3  Layer Guide

This guide serves to provide greater detail about each layer included in the Tribal Water Data Map.

Note on default map settings

When opening the map in Map Viewer, the default layers that will be displayed include all 6 (six) of the Bureau of Indian Affairs layers and the California Regional Boards Boundaries. To see more details about these layers, read below or click on the layer in the Layer Dictionary (see instructions on Map Guide page)

3.1 Tribal Land Layers

3.1.1 Bureau of Indian Affairs (BIA)

Layer displaying different classifications of land allotments from BIA. The Bureau of Land Management Lots layer is included when downloading the zip file of data layers, however, it does not appear on the GIS map and has thus been removed from our map. Please see the contact information below for directing any additional questions.

Source: Bureau of Indian Affairs, from the Pacific Regional Office (PRO)

Source update frequency: As needed

manually updated here June 2025

Contact: BIA

BIA’s mission is to “enhance the quality of life, promote economic opportunities, and to carry out the federal responsibilities entrusted to us to protect and improve the trust assets of American Indians and Alaska Natives. We accomplish this by directly empowering Tribal governments through self-governance agreements.”

3.1.1.1 Indian_Lands

“The term”Indian land” means: (A) Any land located within the boundaries of an Indian reservation, pueblo, or rancheria; (B) Any land not located within the boundaries of an Indian reservation, pueblo, or rancheria, the title to which is help: (i) In trust by the United States for the benefit of an Indian tribe or an individual Indian; (ii) By an Indian tribe or an individual Indian, subject to restriction against alienation under laws of the United States Definition: Indian land from 25 USC § 3501(2) \| LII / Legal Information Institute”, BIA Tract Viewer - Catalog

Screenshot of interactive map showing Indian Land classifications across California

3.1.1.2 Land_Grants

Screenshot of interactive map showing historical land grant boundaries

3.1.1.3 Public_Domain_Allotment_Tracts

These are parcels of Tribal lands, typically up to 160 acres, that were divided up and “allotted” to individual Tribal members, see: Allotment Act of 1887.

Screenshot of interactive map showing public domain allotment tracts

3.1.1.4 Reservation_Boundary

Screenshot of interactive map showing reservation boundaries

This sublayer refers to the outer limits or perimeter of federal American Indian reservations. These boundaries are established by treaties, agreements, executive orders, or other federal actions and define the land reserved for a Tribe or Tribes.

3.1.1.5 Reservation_Tracts

Screenshot of interactive map showing individual reservation tracts

3.1.1.6 All_Tracts

Screenshot of interactive map showing all BIA land tracts

3.1.2 Indigenous Territories

Screenshot of interactive map showing historic Indigenous Territories

Layer displaying historic Indigenous Territories within California.

Source: Native Land Digital

Source update frequency: As needed

manually updated here June 2025

Contact: Native Land Digital

Native Land Digital “strives to create and foster conversations about the history of colonialism, Indigenous ways of knowing, and settler-Indigenous relations, through educational resources such as our map and Territory Acknowledgement Guide. We strive to go beyond old ways of talking about Indigenous people and to develop a platform where Indigenous communities can represent themselves and their histories on their own terms. In doing so, Native Land Digital creates spaces where non-Indigenous people can be invited and challenged to learn more about the lands they inhabit, the history of those lands, and how to actively be part of a better future going forward together.”

3.1.3 Other Sources of American Indian and Tribal Land

3.1.3.1 Tribal Census Tract 2021

Layer showing Tribal areas identified by the U.S. Census Bureau. You can zoom in further to see specific areas more closely.

Source: U.S. Census Bureau, TIGER/Line Shapefiles

Source update frequency: Every 10 years

automatically synced here

Contact: U.S Census Bureau

3.2 Integrated Report and Beneficial Use Layers

3.2.1 2024 Integrated Report

Note

What is the Integrated Report?

Waterbodies assessed in the Integrated Report (IR) include surface waterbodies, such as rivers, lakes, and beaches.

Assessed waterbodies are placed into one of five Integrated Report Condition Categories based on the waterbody’s ability to support beneficial use(s).

The 303(d) list consists of the waterbodies in Categories 4a, 4b, and 5. These waterbodies can be referred to as “listed” or “impaired”.

  • The 303(d) list is based off of Section 303(d) of the Clean Water Act, which requires each state to identify waters that do not meet water quality standards and to prioritize those waters for development of total maximum daily load (TMDL)

  • The Clean Water Act also requires each state to report on the overall condition of its surface waterbodies, which is Section 305(b).

California combines its 303(d) lists and 305(b) reports into a single “California Integrated Report”.

For more information see:

CEDEN - California Environmental Data Exchange Network

2024 Integrated Report | California State Water Resources Control Board

3.2.1.1 State Water Bodies (rivers, streams, and beaches)

Add new IR layer info

Update information to match map updates

This layer shows linear waterbodies in California, such as rivers, streams, and beaches, which were assessed for 305(b) in the 2022-2024 California Integrated Report. Blue waterbodies are listed in Category 1, 2, or 3. Orange waterbodies represent those placed on the 303(d) list of impaired waters.

Screenshot of interactive map showing the rivers and streams in the Integrated Report

Note, these are not the final assessments. 

Source: 2024 California Integrated Report

Source update frequency: Every 2 years

automatically synced here

Contact: SWRCB Water Quality Assessment Program

3.2.1.2 State Water Bodies (bays, lakes and reservoirs)

This layer shows non-linear (polygon) waterbodies in California, such as bays, lakes, and reservoirs, which were assessed for 305(b) in the 2020-2022 California Integrated Report. Blue waterbodies are listed in Category 1, 2, or 3. Orange waterbodies represent those placed on the 303(d) list of impaired waters.

Screenshot of interactive map showing the bays, lakes, and reservoirs in the Integrated Report

Note, these are not the final assessments. 

Source: 2024 California Integrated Report

Source update frequency: Every 2 years

automatically synced here

Contact: SWRCB Water Quality Assessment Program

3.2.2 Waterbodies that haven’t been assessed

3.2.2.1 State Water Bodies (rivers, streams, and beaches)

Screenshot of interactive map showing unassessed rivers, streams, and beaches

Source: National Hydrography Dataset

Source update frequency: Every 2 years

Note
Note

This layer has not been updated since 2024 and therefore does not accurately reflect all waterbodies that have not been assessed. There are some waterbodies in the NHD layer that are not assessed in the IR layers. If you have further questions, please refer to the contact information below.

automatically synced here

Contact: California State Water Resources Control Board

3.2.2.2 State Water Bodies (bays, lakes and reservoirs)

this layer appears to now be in a combined rivers/streams/beaches + bays/lakes etc. layer

3.2.3 Basin Plan Beneficial Uses

Note

What are Beneficial Uses?

Waters that are used for specific purposes (see codes below or in layer properties on the map). These beneficial use waters are designated in regional water board water quality control plans.

Some examples of beneficial uses include: protection and propagation of fish, recreation, agriculture, etc. Waters are often designated with more than one beneficial use.

To ensure the protection of these waters and their beneficial uses, state and regional water quality control plans establish maximum levels of pollutants. When these maximum levels are exceeded and waters cannot support their designated beneficial uses, that is when they are listed as 303(d) or impaired waters.

Screenshot of interactive map showing Basin Plan Beneficial Uses

Source: CA State Water Resources Control Board - Basin Plan Portal

Source update frequency: ?

automatically synced here

Contact: CA State Water Resources Control Board - Basin Plan Portal

3.3 CalEnviroScreen

What is CalEnviroScreen?

CalEnviroScreen is a science-based screening tool that is used to evaluate communities on pollution burdens and the vulnerability of people living in the communities in order to help identify areas that are disproportionately burdened by cumulative impacts of multiple pollutants and the related health effects.

Results of CalEnviroScreen can be used to help direct resources to those disproportionately affected communities. Darker colors represent higher CalEnviroScreen Scores.

If you are curious to learn more about CalEnviroScreen beyond the questions below, you can access the Office of Environmental Health Hazard Assessment training videos here.

How is the CalEnviroScreen Score calculated?

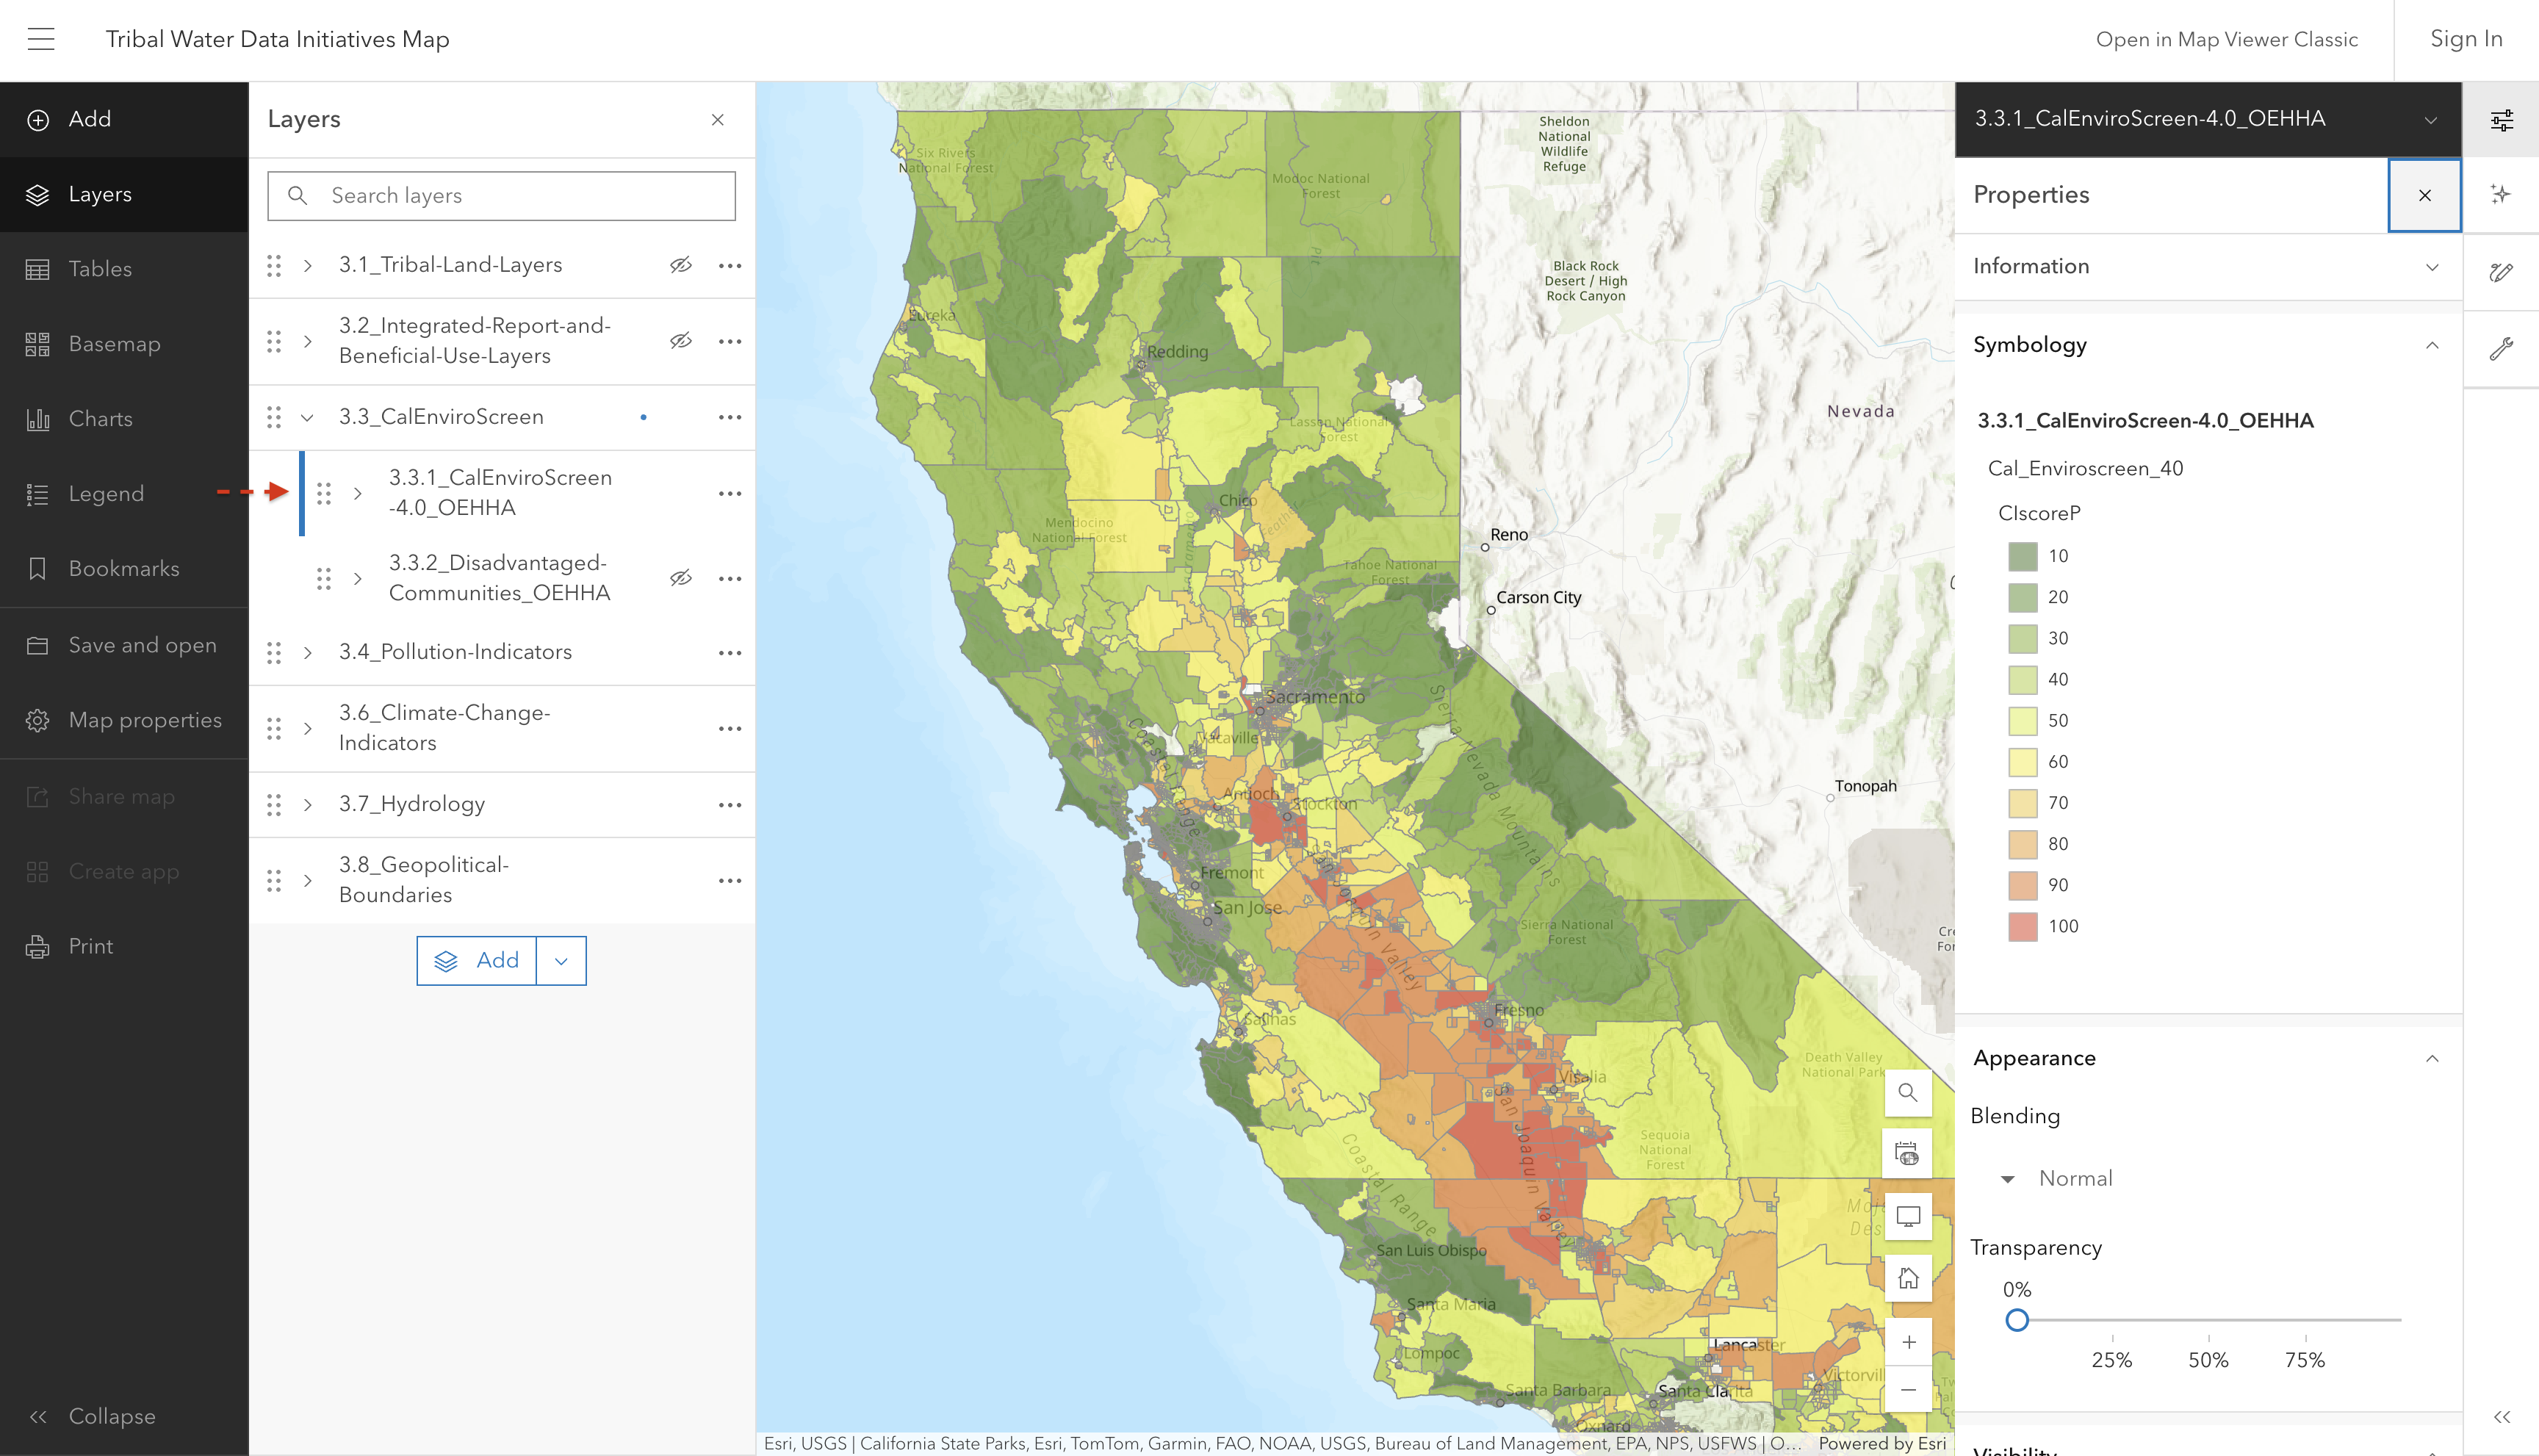
The CalEnviroScreen score uses Census Tract information and compares levels of exposure, environmental effects, sensitive populations, and socioeconomic factors across tracts.

OEHHA converts raw data values for each indicator into a percentile to be able to compare results across the state.

After each indicator is assigned a percentage, OEHHA calculates the average of the exposure indicator percentiles and the average of the environmental effect percentiles. These two averages are then combined and divided by 10 to calculate the Pollution Burden score, which ranges from 0-10.

This same process is completed for the Population Characteristics, which combines the averages of the indicators for sensitive populations and socioeconomic factors.

The overall CalEnviroScreen score is calculated by multiplying the pollution burden by the population characteristics, and ranges from 0-100. This method allows scores from across all census tracts in the state to be compared. A higher score means that a tract has greater overall population vulnerability and pollution burdens. A CalEnviroScreen score is calculated for 8,000 Census Tracts.

See Training Module 6 for more information and detailed examples

3.3.1 CalEnviroScreen 4.0

This layer shows the CalEnviroScreen (CES) 4.0 based on the CES Score percentile.

CalEnviroScreen is a screening methodology that can be used to help identify California communities that are disproportionately burdened by multiple sources of pollution. CI score ranges from 10 to 100. For more information on CalEnviroScreen scoring, see above.

Screenshot of interactive map showing CalEnviroScreen scores by census tract

Source: California Office of Environmental Health Hazard Assessment (OEHHA)

Source update frequency: As needed

automatically synced here

Contact: CalEnviroScreen

3.3.2 Disadvantaged Communities

This map shows the disadvantaged communities designated by CalEPA for the purpose of SB 535. These areas represent the 25% highest scoring census tracts in CalEnviroScreen 4.0, census tracts previously identified in the top 25% in CalEnviroScreen 3.0, census tracts with high amounts of pollution and low populations, and federally recognized tribal areasas identified by the Census in the 2021 American Indian Areas Related National Geodatabase.

Screenshot of interactive map showing disadvantaged communities in CalEnviroScreen 4.0

Source: California Office of Environmental Health Hazard Assessment (OEHHA)

Source update frequency: As needed

automatically synced here

Contact: CalEnviroScreen

3.4 Pollution Indicators

3.4.1 Agricultural Pesticides

This indicator represents the reported use of 132 hazardous and volatile pesticides in 2017-2019. Only pesticides used on agricultural commodities are included in the indicator. The data is averaged over the census tract area, and some application may be adjacent to (instead of within) the census tract.

Screenshot of interactive map showing pesticide use intensity by census tract

Source: California Office of Environmental Health Hazard Assessment (OEHHA)

Source update frequency: As needed

automatically synced here

Contact: CalEnviroScreen

3.4.2 Superfund Enterprise Management System Sites

This layer shows location and attribute information on facilities regulated under the Superfund Enterprise Management System (SEMS). Data includes the inventory of active and archived hazardous waste sites evaluated by the EPA’s Superfund program.

Screenshot of interactive map showing EPA Superfund sites

Source: U.S. Environmental Protection Agency (EPA)

Source update frequency: As needed

manually updated here June 2025

Contact: U.S Environmental Protection Agency (EPA)

3.4.3 Superfund Enterprise Management System National Priority List (NPL) Sites

This layer shows sites that are listed on the Superfund NPL. The NPL lists national priorities among the known releases or threatened releases of hazardous substances, pollutants, or contaminants throughout the United States.

screenshot coming soon

Source: U.S. Environmental Protection Agency (EPA)

Source update frequency: As needed

manually updated here June 2025

Contact: U.S Environmental Protection Agency (EPA)

3.4.4 NPL Superfund Site Boundaries

This layer shows entire Superfund site boundaries.

Screenshot of interactive map showing NPL Superfund Site boundaries

U.S. EPA Superfund Site boundaries are polygons representing the footprint of a whole site, defined for purposes of this effort as the sum of all of the Operable Units and the current understanding of the full extent of contamination.

Source: U.S. Environmental Protection Agency (EPA)

Source update frequency: Monthly

manually updated here June 2025

Contact: U.S Environmental Protection Agency (EPA)

3.4.5 Oil and Gas Wells

This layer shows oil and gas well locations (and their associated records) across California.

Screenshot of interactive map showing oil and gas well locations

Source: WellFinder, published by the California Department of Conservation and Geologic Energy Management Division

Source update frequency: As needed

automatically synced here

Contact: WellFinder

3.4.6 Mines

This layer shows all mines in California.

Screenshot of interactive map showing mine locations

This data is published with the intent to aid mine reclamation and is gathered via annual reports under Public Resources Code section 2207.

Source: California Department of Conservation Division of Mine Reclamation

Source update frequency: As needed

automatically synced here

Contact: California Department of Conservation - Division of Mine Reclamation

3.4.7 Aquifer Water Quality Risk

Source: California State Water Resources Control Board

Source update frequency: Every year

automatically synced here

Contact: California State Water Resources Control Board

3.4.7.1 State Small Water Systems

Screenshot of interactive map showing state small water systems

3.4.7.2 Source Data (All Contaminants)

Screenshot of interactive map showing source contaminant data

3.4.7.3 Water Quality Risk by Section (All Contaminants)

This layer shows estimated water quality risk for domestic wells and state small water systems for a variety of contaminants.

This layer was developed for use by the State Water Boards SAFER Program to help prioritize areas where domestic wells and state small water systems may be accessing groundwater that does not meet primary drinking water standards.

Screenshot of interactive map showing estimated water quality risk

Source: Groundwater Ambient Monitoring and Assessment (GAMA) Program

Source update frequency: As needed

automatically synced here

Contact: SAFER Program

3.4.7.4 Arsenic

Screenshot of interactive map showing arsenic risk

3.4.7.5 Hexavalent Chromium

Screenshot of interactive map showing hexavalent chromium risk

3.4.7.6 Nitrate

Screenshot of interactive map showing nitrate risk

3.4.7.7 Tricholoropropane

Screenshot of interactive map showing trichloropropane risk

3.4.7.8 Uranium

Screenshot of interactive map showing uranium risk

3.4.8 Cleanup Program Sites

Note

The Cleanup Program Sites have 36 different classifications. For ease of viewing on this map, we have combined similar classifications into groups. You can find the specific classification if you click on the individual point of interest, or you can refer here for the full list.

Screenshot of interactive map showing cleanup program sites

Source: GeoTracker

Source update frequency: Daily

manually updated here June 2025

Contact: GeoTracker

3.4.9 Regulated Wastewater Treatment & Discharge Facilities

Layer showing National Pollutant Discharge Elimination System (NPDES) and Waste Discharge Requirements (WDR) facilities regulated by State Water Board programs, as reflected in the California Integrated Water Quality System (CIWQS) project.

Screenshot of interactive map showing wastewater discharge facilities

These facilities are mandated to hold active permits to discharge into or alter the surface or ground water. More information about these permits can be found in the CIWQS database.

Source: California Integrated Water Quality System (CIWQS)

Source update frequency: Daily

automatically synced here

Contact: California Integrated Water Quality System (CIWQS)

3.4.10 Sanitary Sewer System Spills

Layer showing locations with sanitary sewer system spills.

Screenshot of interactive map showing sanitary sewer system spills

Source: California Integrated Water Quality System (CIWQS)

Source update frequency: Daily

automatically synced here

Contact: California Integrated Water Quality System (CIWQS)

3.5 Water Quality

New layers coming soon

3.6 Climate Change Indicators

3.6.1 Drought Intensity

Drought Outlook: This layer shows regions in California impacted by drought.

Screenshot of interactive map showing drought intensity in California

Drought severity is determined by precipitation deviation, stream flow, soil moisture content, subjective observation, and reported impact.

Source: U.S. Drought Monitor

Source update frequency: Weekly, on Thursdays

automatically synced here

Contact: National Drought Mitigation Center (NDMC)

3.7 Hydrology

3.7.1 Groundwater Basins

This layer shows the boundaries of 515 groundwater basins and subbasins as defined by the California Department of Water Resources.

Screenshot of interactive map showing groundwater basins and boundaries

Source: California Department of Water Resources

Source update frequency: As needed

automatically synced here

Contact: California Department of Water Resources

3.7.2 Hydrography, Water Boundaries

The California Interagency Watershed Map is the State of California’s working definition of watershed boundaries. Previous Calwater versions described California watersheds, beginning with the division of the State’s 101 million acres into ten Hydrologic Regions (HR). Each HR is progressively subdivided into six smaller, nested levels: the Hydrologic Unit (HU, major rivers), Hydrologic Area (HA, major tributaries), Hydrologic Sub-Area (HSA), Super Planning Watershed (SPW), and Planning Watershed (PW), with the Planning Watershed as the most detailed level. See metadata for more information.

Screenshot of interactive map showing watershed boundaries at the region level

Screenshot of interactive map showing watershed boundaries at the unit level

Screenshot of interactive map showing watershed boundaries at the area level

Screenshot of interactive map showing watershed boundaries at the subarea level

Screenshot of interactive map showing watershed boundaries at the super planning level

Screenshot of interactive map showing watershed boundaries at the planning level

Source: CalWater Watersheds - Overview

Source update frequency: As needed

automatically synced here

Contact: California Interagency Watershed Mapping Group

3.8 Geopolitical Boundaries

3.8.1 Regional Water Board Boundaries

Layer showing the boundaries of the nine Regional Water Quality Control Boards in California.

Screenshot of interactive map showing Regional Water Board Boundaries

Source: California State Water Resources Control Board (SWRCB)

Source update frequency: As needed

automatically synced here

Contact: CA State Water Resources Control Board

3.8.2 Census Tracts

3.8.3 County Boundaries

This layer shows County boundaries within California.

Screenshot of interactive map showing California county boundaries

In this dataset, all bays (plus bay islands and constructed features) are merged into the mainland, and coastal features (such as islands and constructed features) are not included, with the exception of the Channel Islands which ARE included.

Source: California Dept. of Forestry and Fire Protection (CalFIRE)

Source update frequency: As needed

automatically synced here

Contact: CAL FIRE eGIS

3.8.4 Non-private Land Holders

This layer shows boundaries for non-private land holders in California.

Screenshot of interactive map showing non-private land holders

Source: California Land Ownership | California State Geoportal

Source update frequency: As needed

automatically synced here

Contact: CAL FIRE eGIS

3.8.5 State Park Boundaries

This layer shows the State Parks in California.

Screenshot of interactive map showing State Park boundaries in California

Source: California State Parks

Source update frequency: As needed

automatically synced here

Contact: Department of Parks and Recreation

3.8.6 Groundwater Sustainability Agencies

This layer shows the boundaries of California’s Groundwater Sustainability Agencies as defined on the DWR SGMA Data Viewer.

Screenshot of interactive map showing Groundwater Sustainability Agencies

Source: California Department of Water Resources, for use by Groundwater Ambient Monitoring and Assessment (GAMA) Program

Source update frequency: As needed

automatically synced here

Contact: Department of Water Resources GIS

3.8.7 Marine Protected Areas

California’s MPA Network includes different types of MPAs as well as other designations. Each designation is unique in its purpose and allowed uses - CDFW

State Marine Reserve (SMP): An MPA where no take, damage, injury, or possession of any living, geologic, or cultural marine resource is allowed.

No-Take State Marine Conservation Area (NoTake SMCA): An MPA where no take of any living, geologic, or cultural resource is allowed, EXCEPT for take incidental to specified activities permitted by other agencies (e.g. infrastructure maintenance, sand renourishment).

State Marine Park (SMP): An MPA that allows some recreational take but does not allow commerical take.

State Marine Conservation Area (SMCA): An MPA where some recreational and/or commercial take of marine resources may be allowed (restrictions vary)

State Marine Recreational Management Area (SMRMA): A marine managed area where some take of marine resources may be allowed and legal waterfowl hunting is allowed (restrictions vary)

Special Closure: Prohibits or restricts access in waters adjacent to seabird rookeries or marine mammal haul-out sites.

Screenshot of interactive map showing Marine Protected Areas along the coast

Source: California Marine Protected Areas [ds582] GIS Dataset

Source update frequency: As needed

manually updated here June 2025

Contact: California Department of Fish and Wildlife - Marine Protected Areas