3  Layer Guide

This guide serves to provide greater detail about each layer included in the Tribal Data Mapping Tool.

NoteNote on default map settings

When opening the map in Map Viewer, the default layers that will be displayed include all 6 (six) of the Bureau of Indian Affairs layers and the California Regional Boards Boundaries. To see more details about these layers, read below or click on the layer in the Layer Dictionary (see instructions on Map Guide page)

3.1 Tribal Land Layers

3.1.1 Bureau of Indian Affairs (BIA)

Layer displaying different classifications of land allotments from BIA. The Bureau of Land Management Lots layer is included when downloading the zip file of data layers, however, it does not appear on the GIS map and has thus been removed from our map. Please see the contact information below for directing any additional questions.

Source: Bureau of Indian Affairs, from the Pacific Regional Office (PRO)

Source update frequency: As needed

The data from BIA was downloaded and manually updated here in June 2025 and will be updated if/when BIA makes the data publicly available again.

Contact: BIA

BIA’s mission is to “enhance the quality of life, promote economic opportunities, and to carry out the federal responsibilities entrusted to us to protect and improve the trust assets of American Indians and Alaska Natives. We accomplish this by directly empowering Tribal governments through self-governance agreements.”

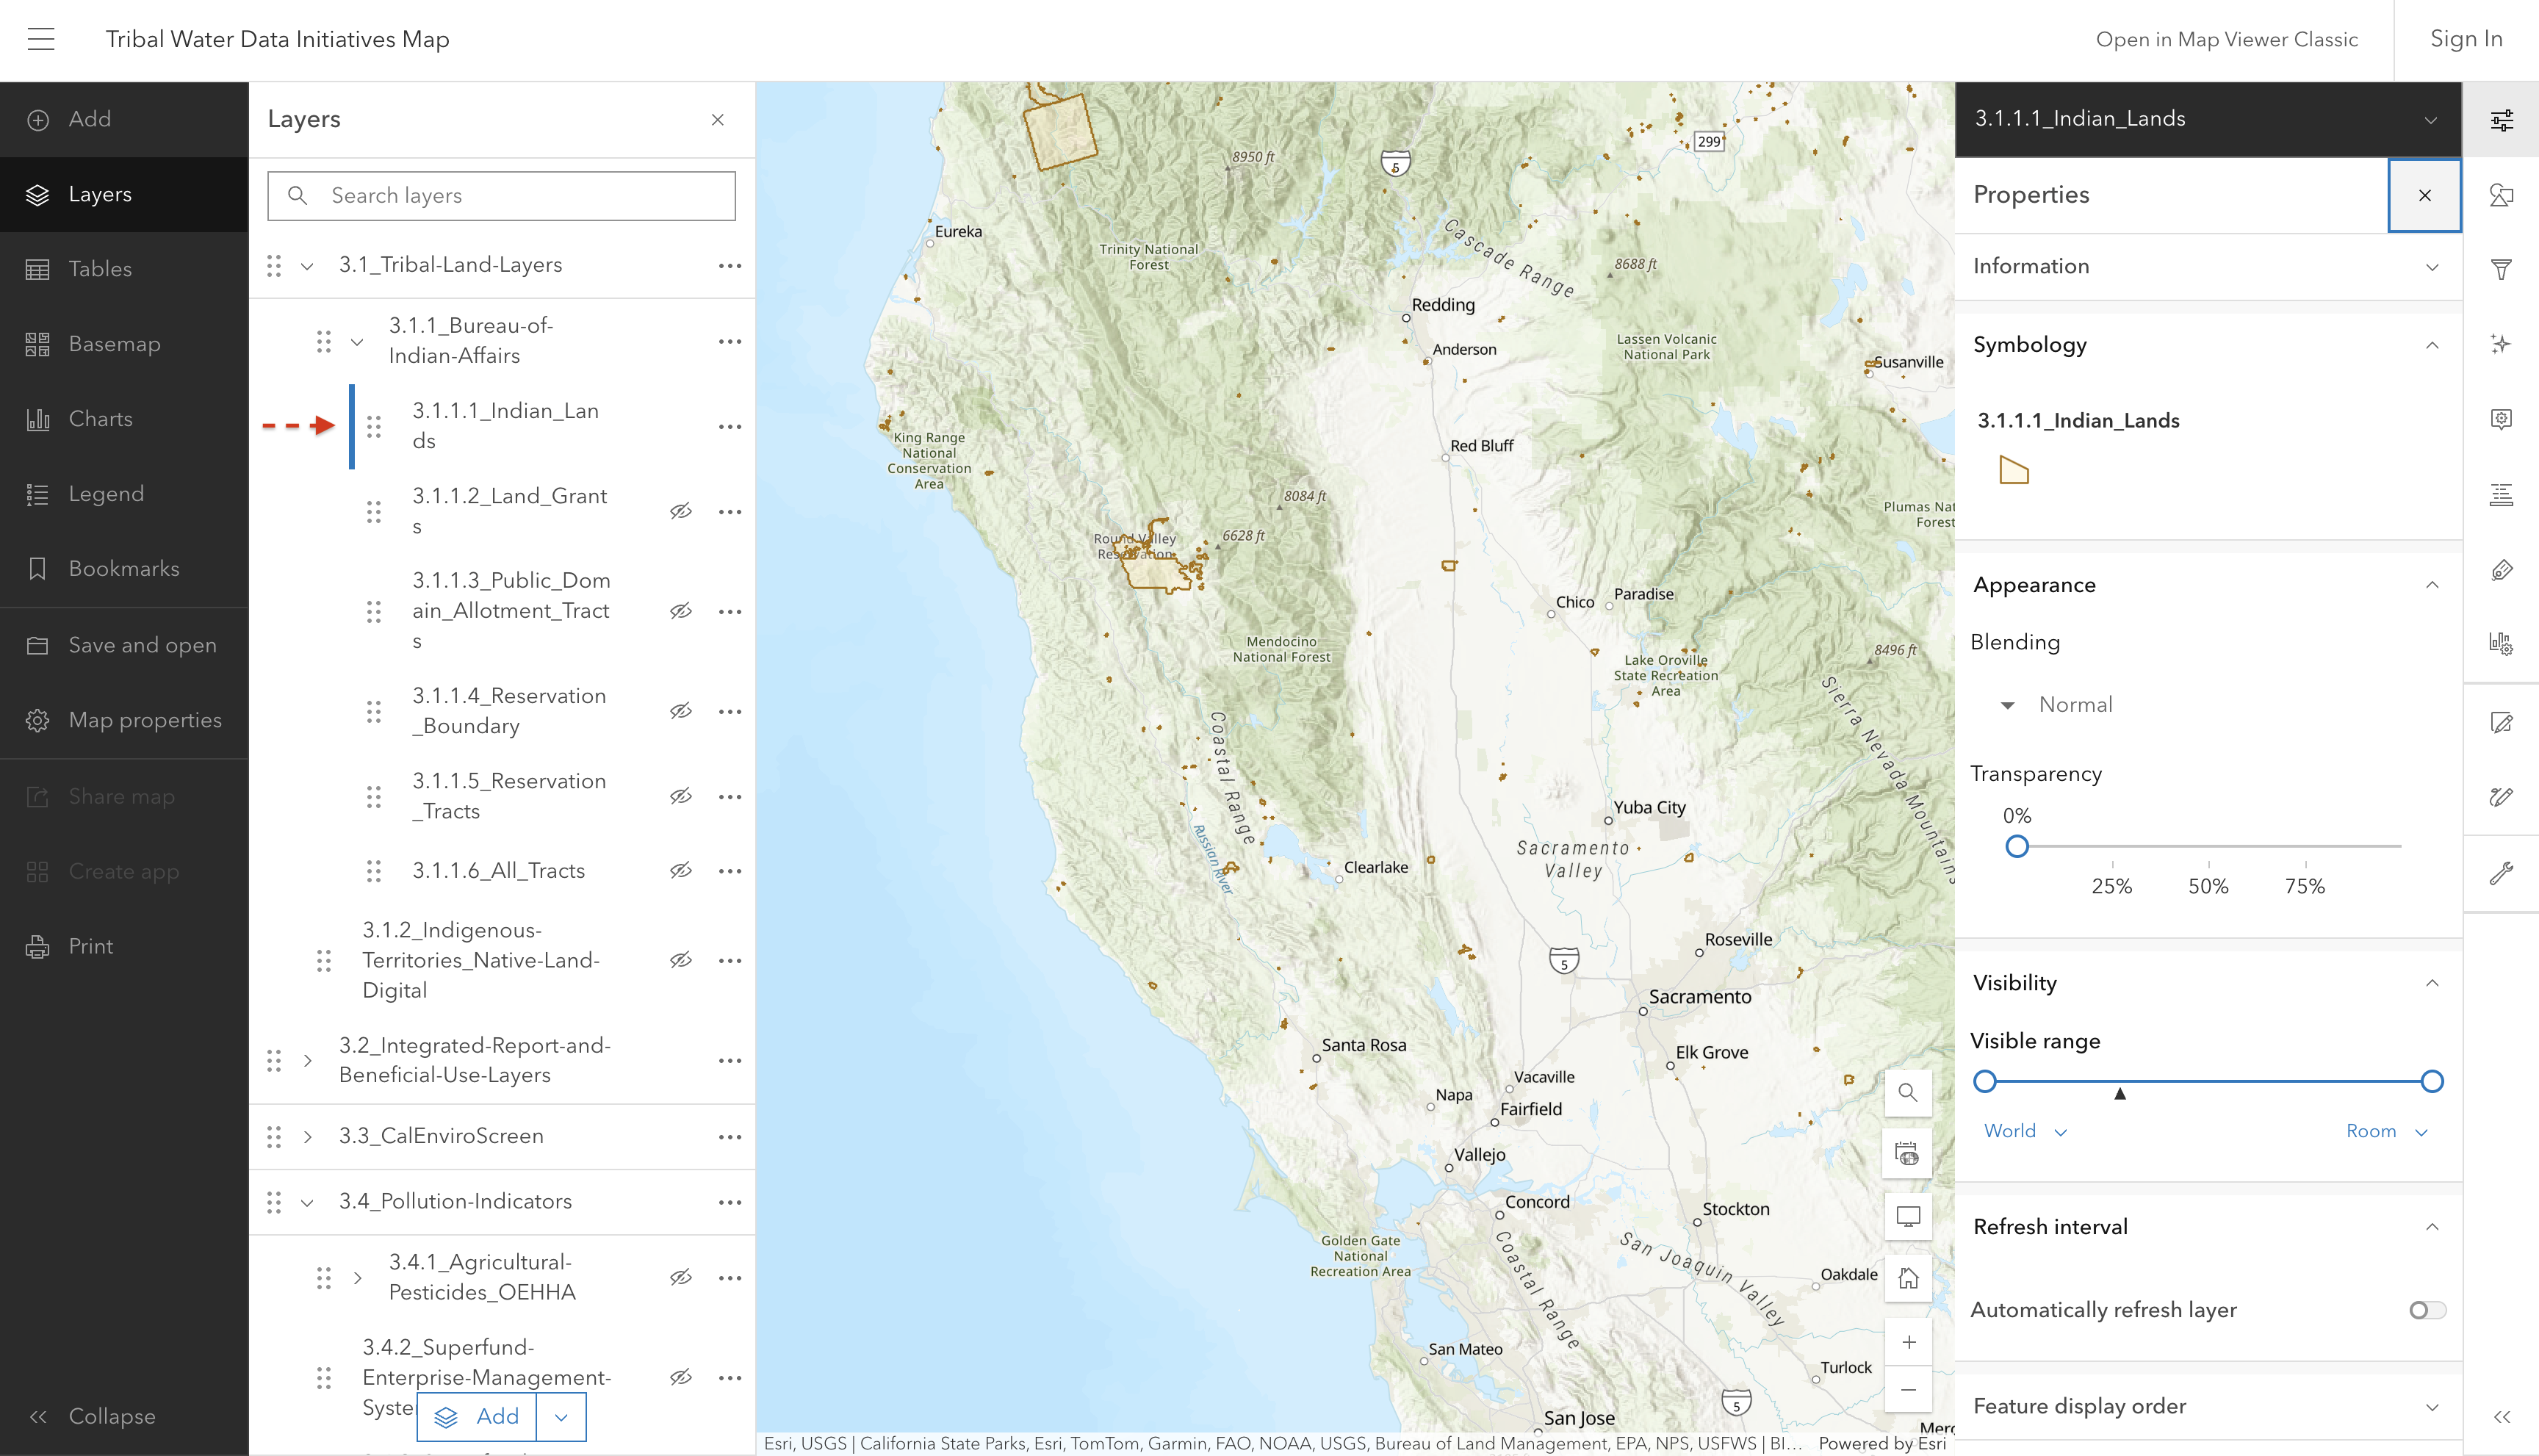
3.1.1.1 Indian_Lands

“The term”Indian land” means: (A) Any land located within the boundaries of an Indian reservation, pueblo, or rancheria; (B) Any land not located within the boundaries of an Indian reservation, pueblo, or rancheria, the title to which is help: (i) In trust by the United States for the benefit of an Indian tribe or an individual Indian; (ii) By an Indian tribe or an individual Indian, subject to restriction against alienation under laws of the United States Definition: Indian land from 25 USC § 3501(2) \| LII / Legal Information Institute”, BIA Tract Viewer - Catalog

Screenshot of interactive map showing Indian Land classifications across California

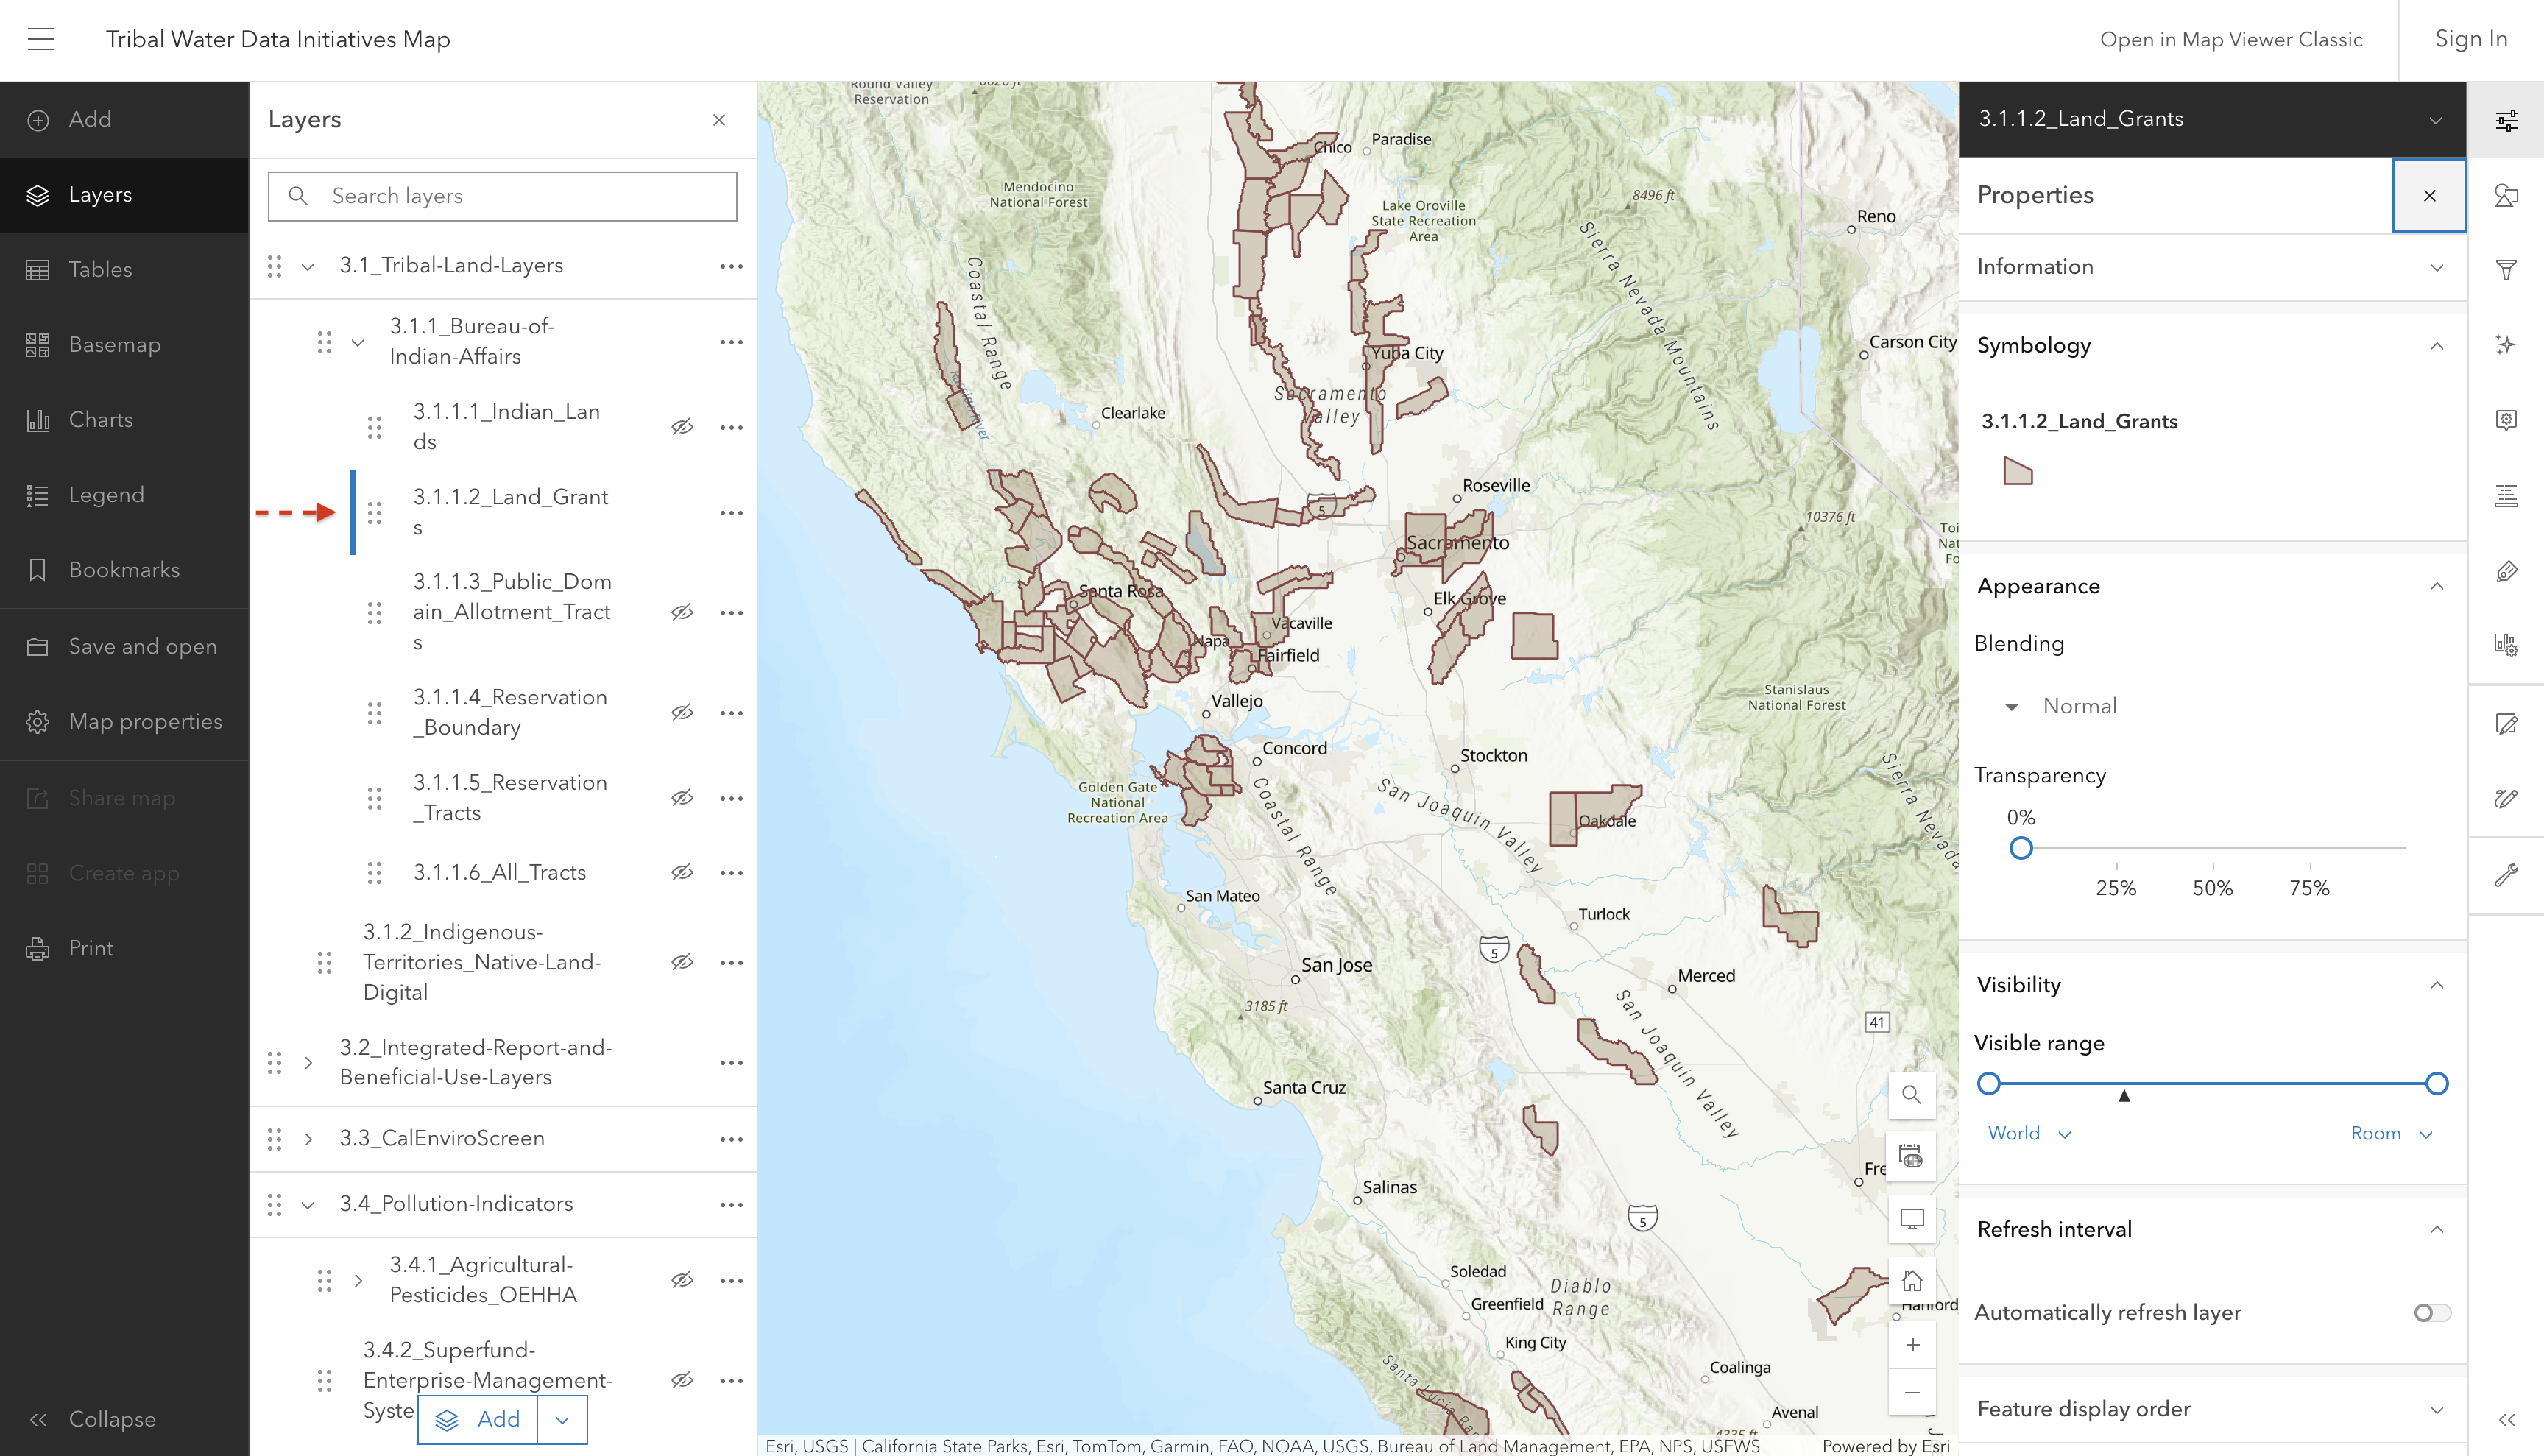
3.1.1.2 Land_Grants

Screenshot of interactive map showing historical land grant boundaries

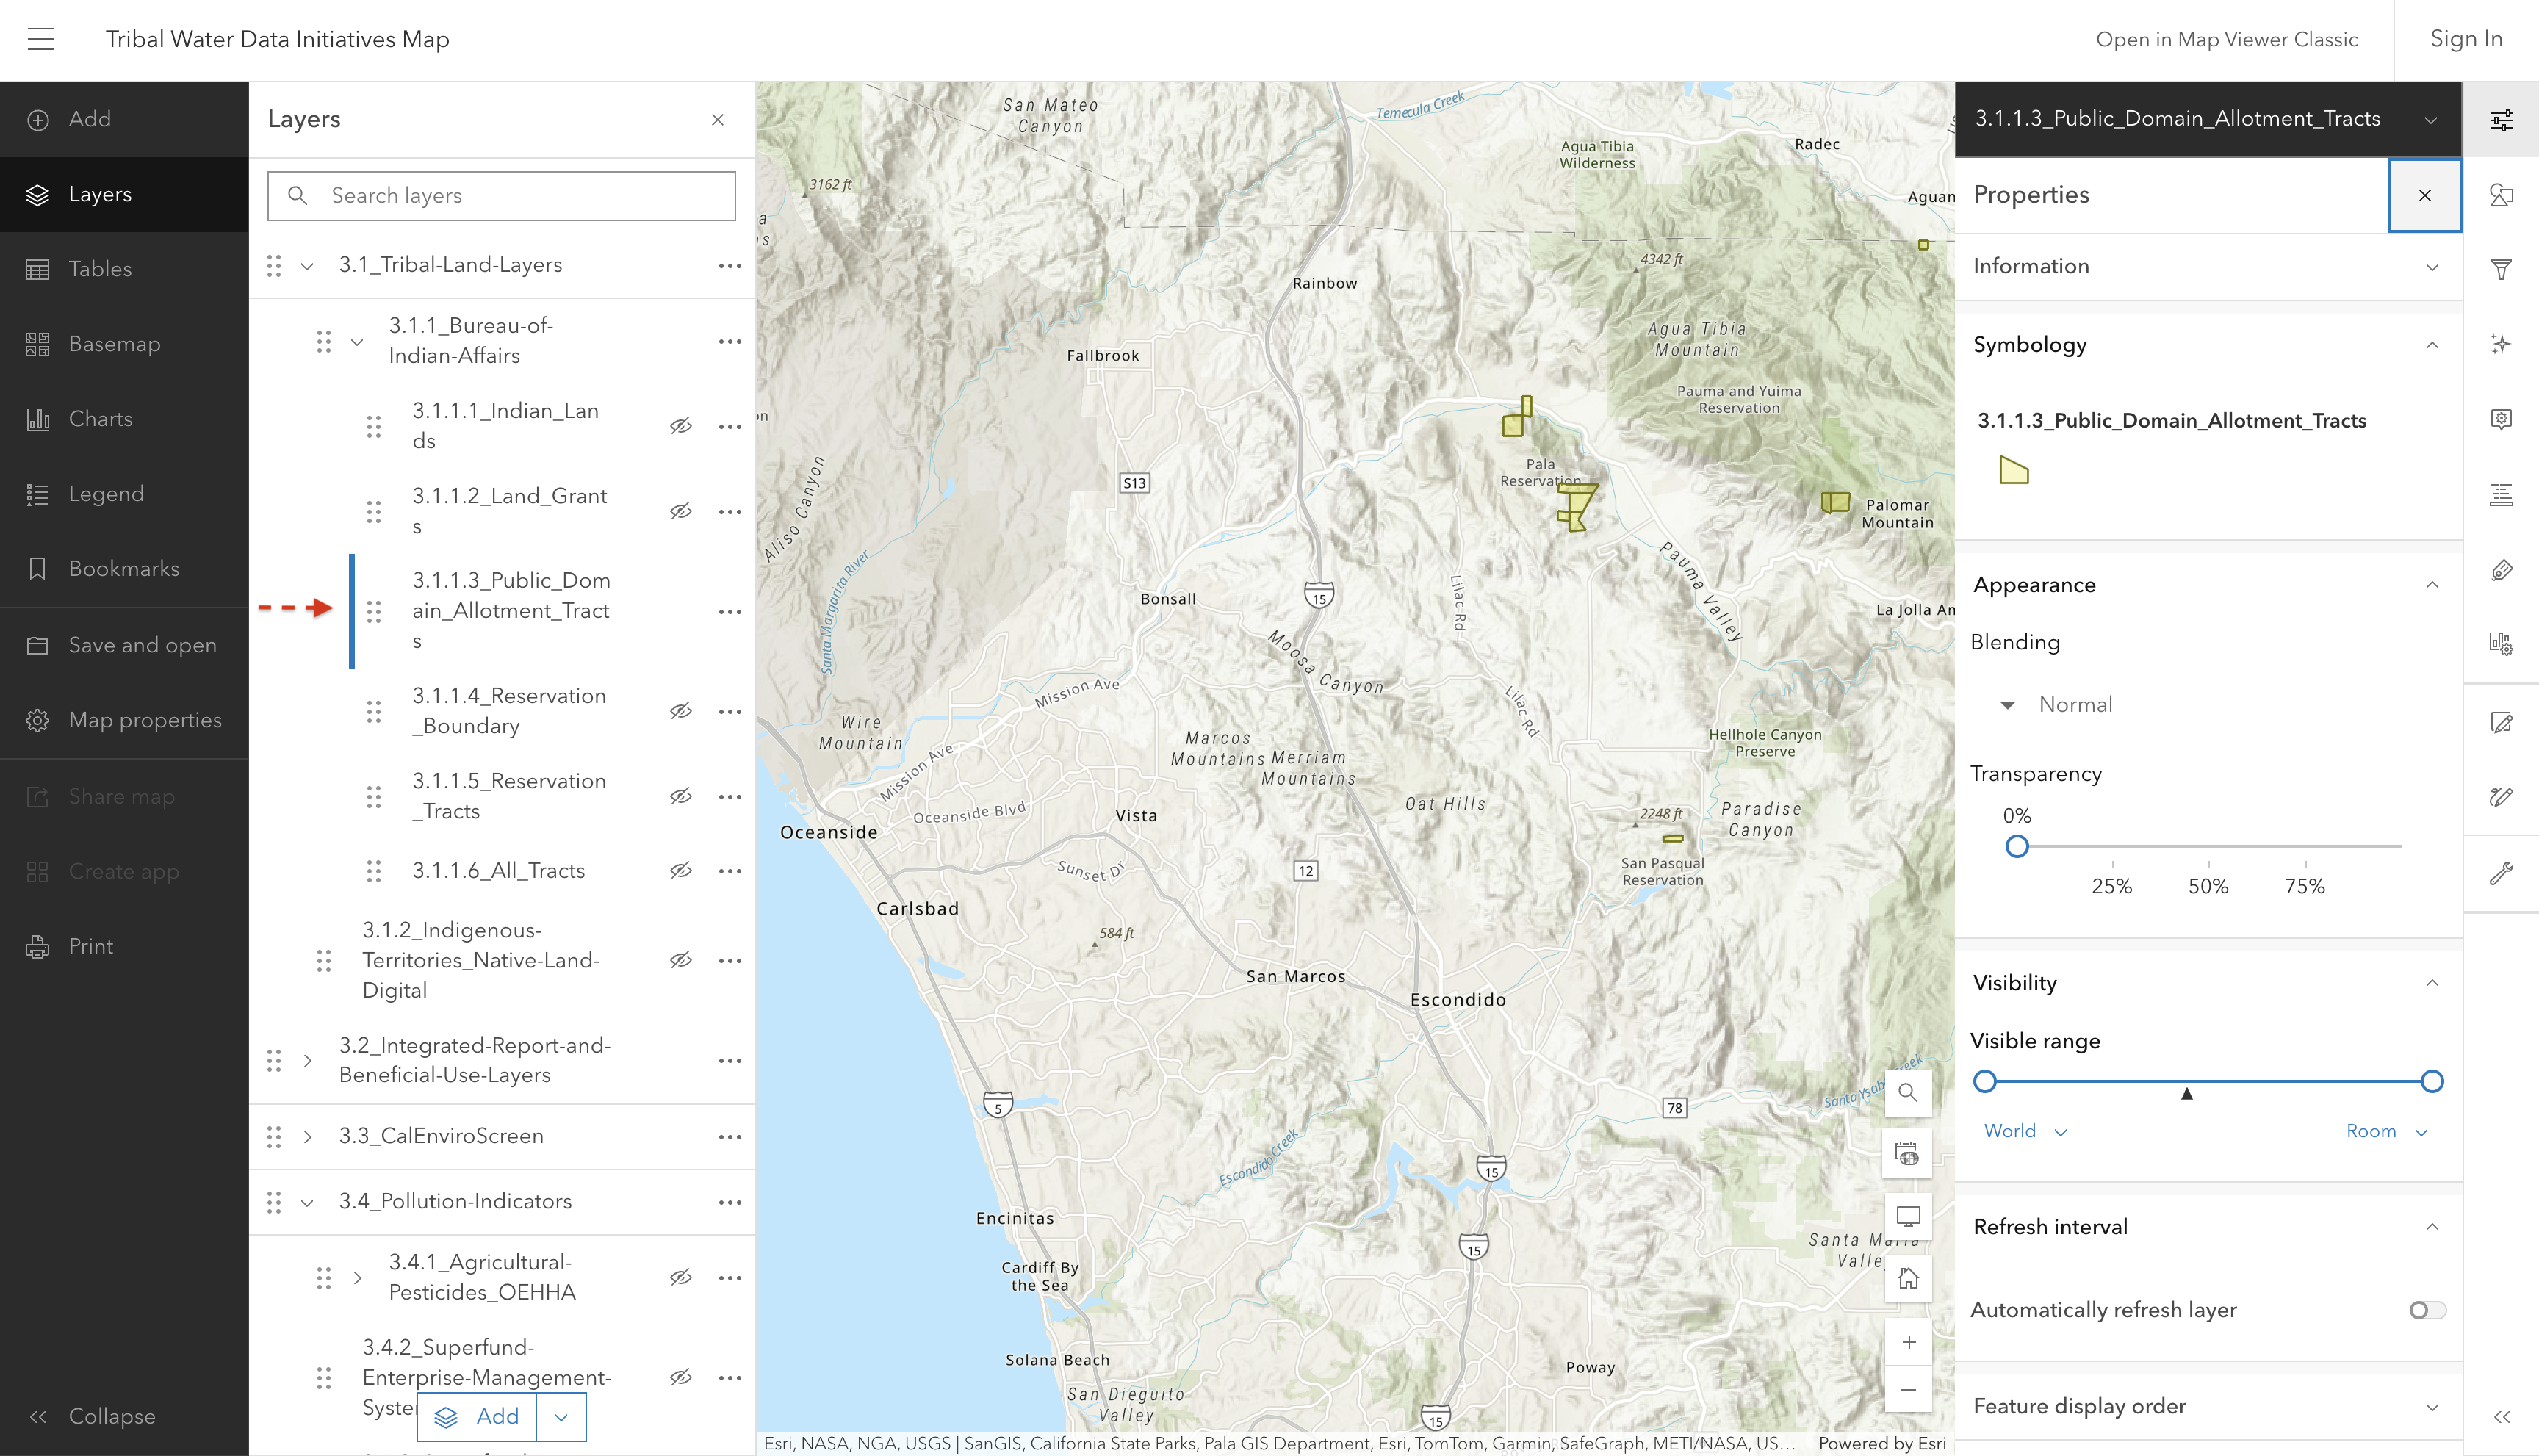
3.1.1.3 Public_Domain_Allotment_Tracts

These are parcels of Tribal lands, typically up to 160 acres, that were divided up and “allotted” to individual Tribal members, see: Allotment Act of 1887.

Screenshot of interactive map showing public domain allotment tracts

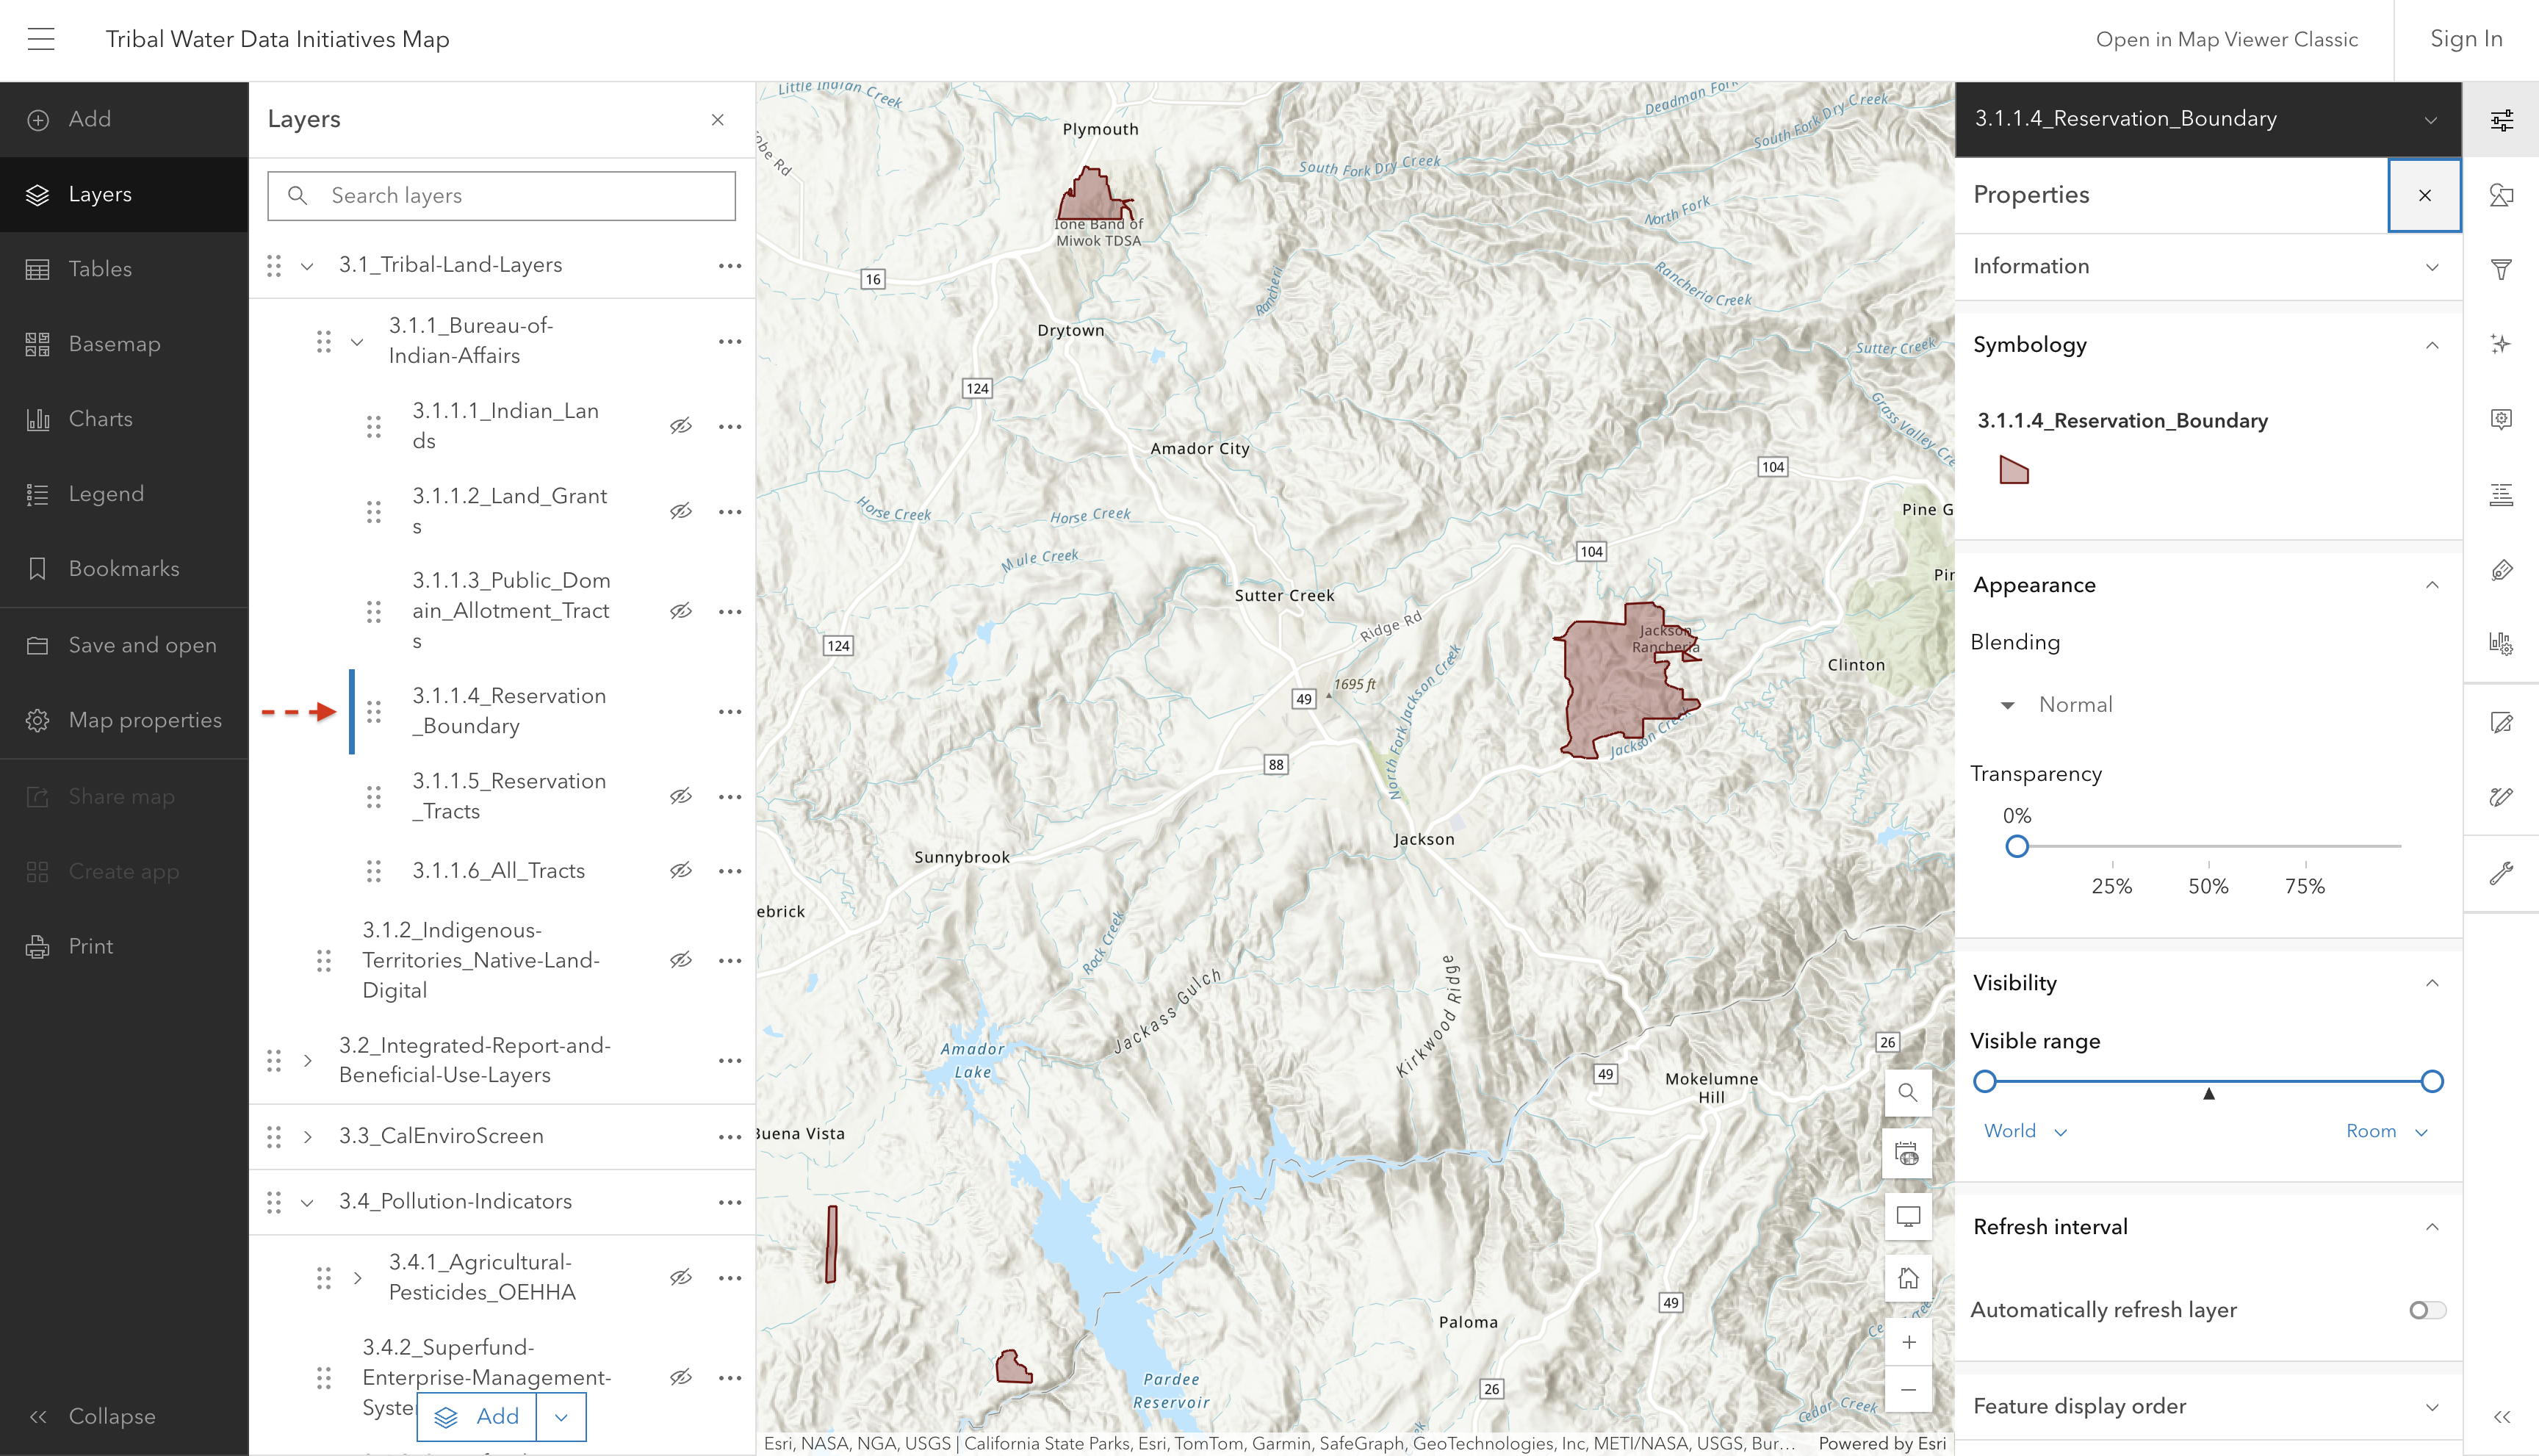
3.1.1.4 Reservation_Boundary

Screenshot of interactive map showing reservation boundaries

This sublayer refers to the outer limits or perimeter of federal American Indian reservations. These boundaries are established by treaties, agreements, executive orders, or other federal actions and define the land reserved for a Tribe or Tribes.

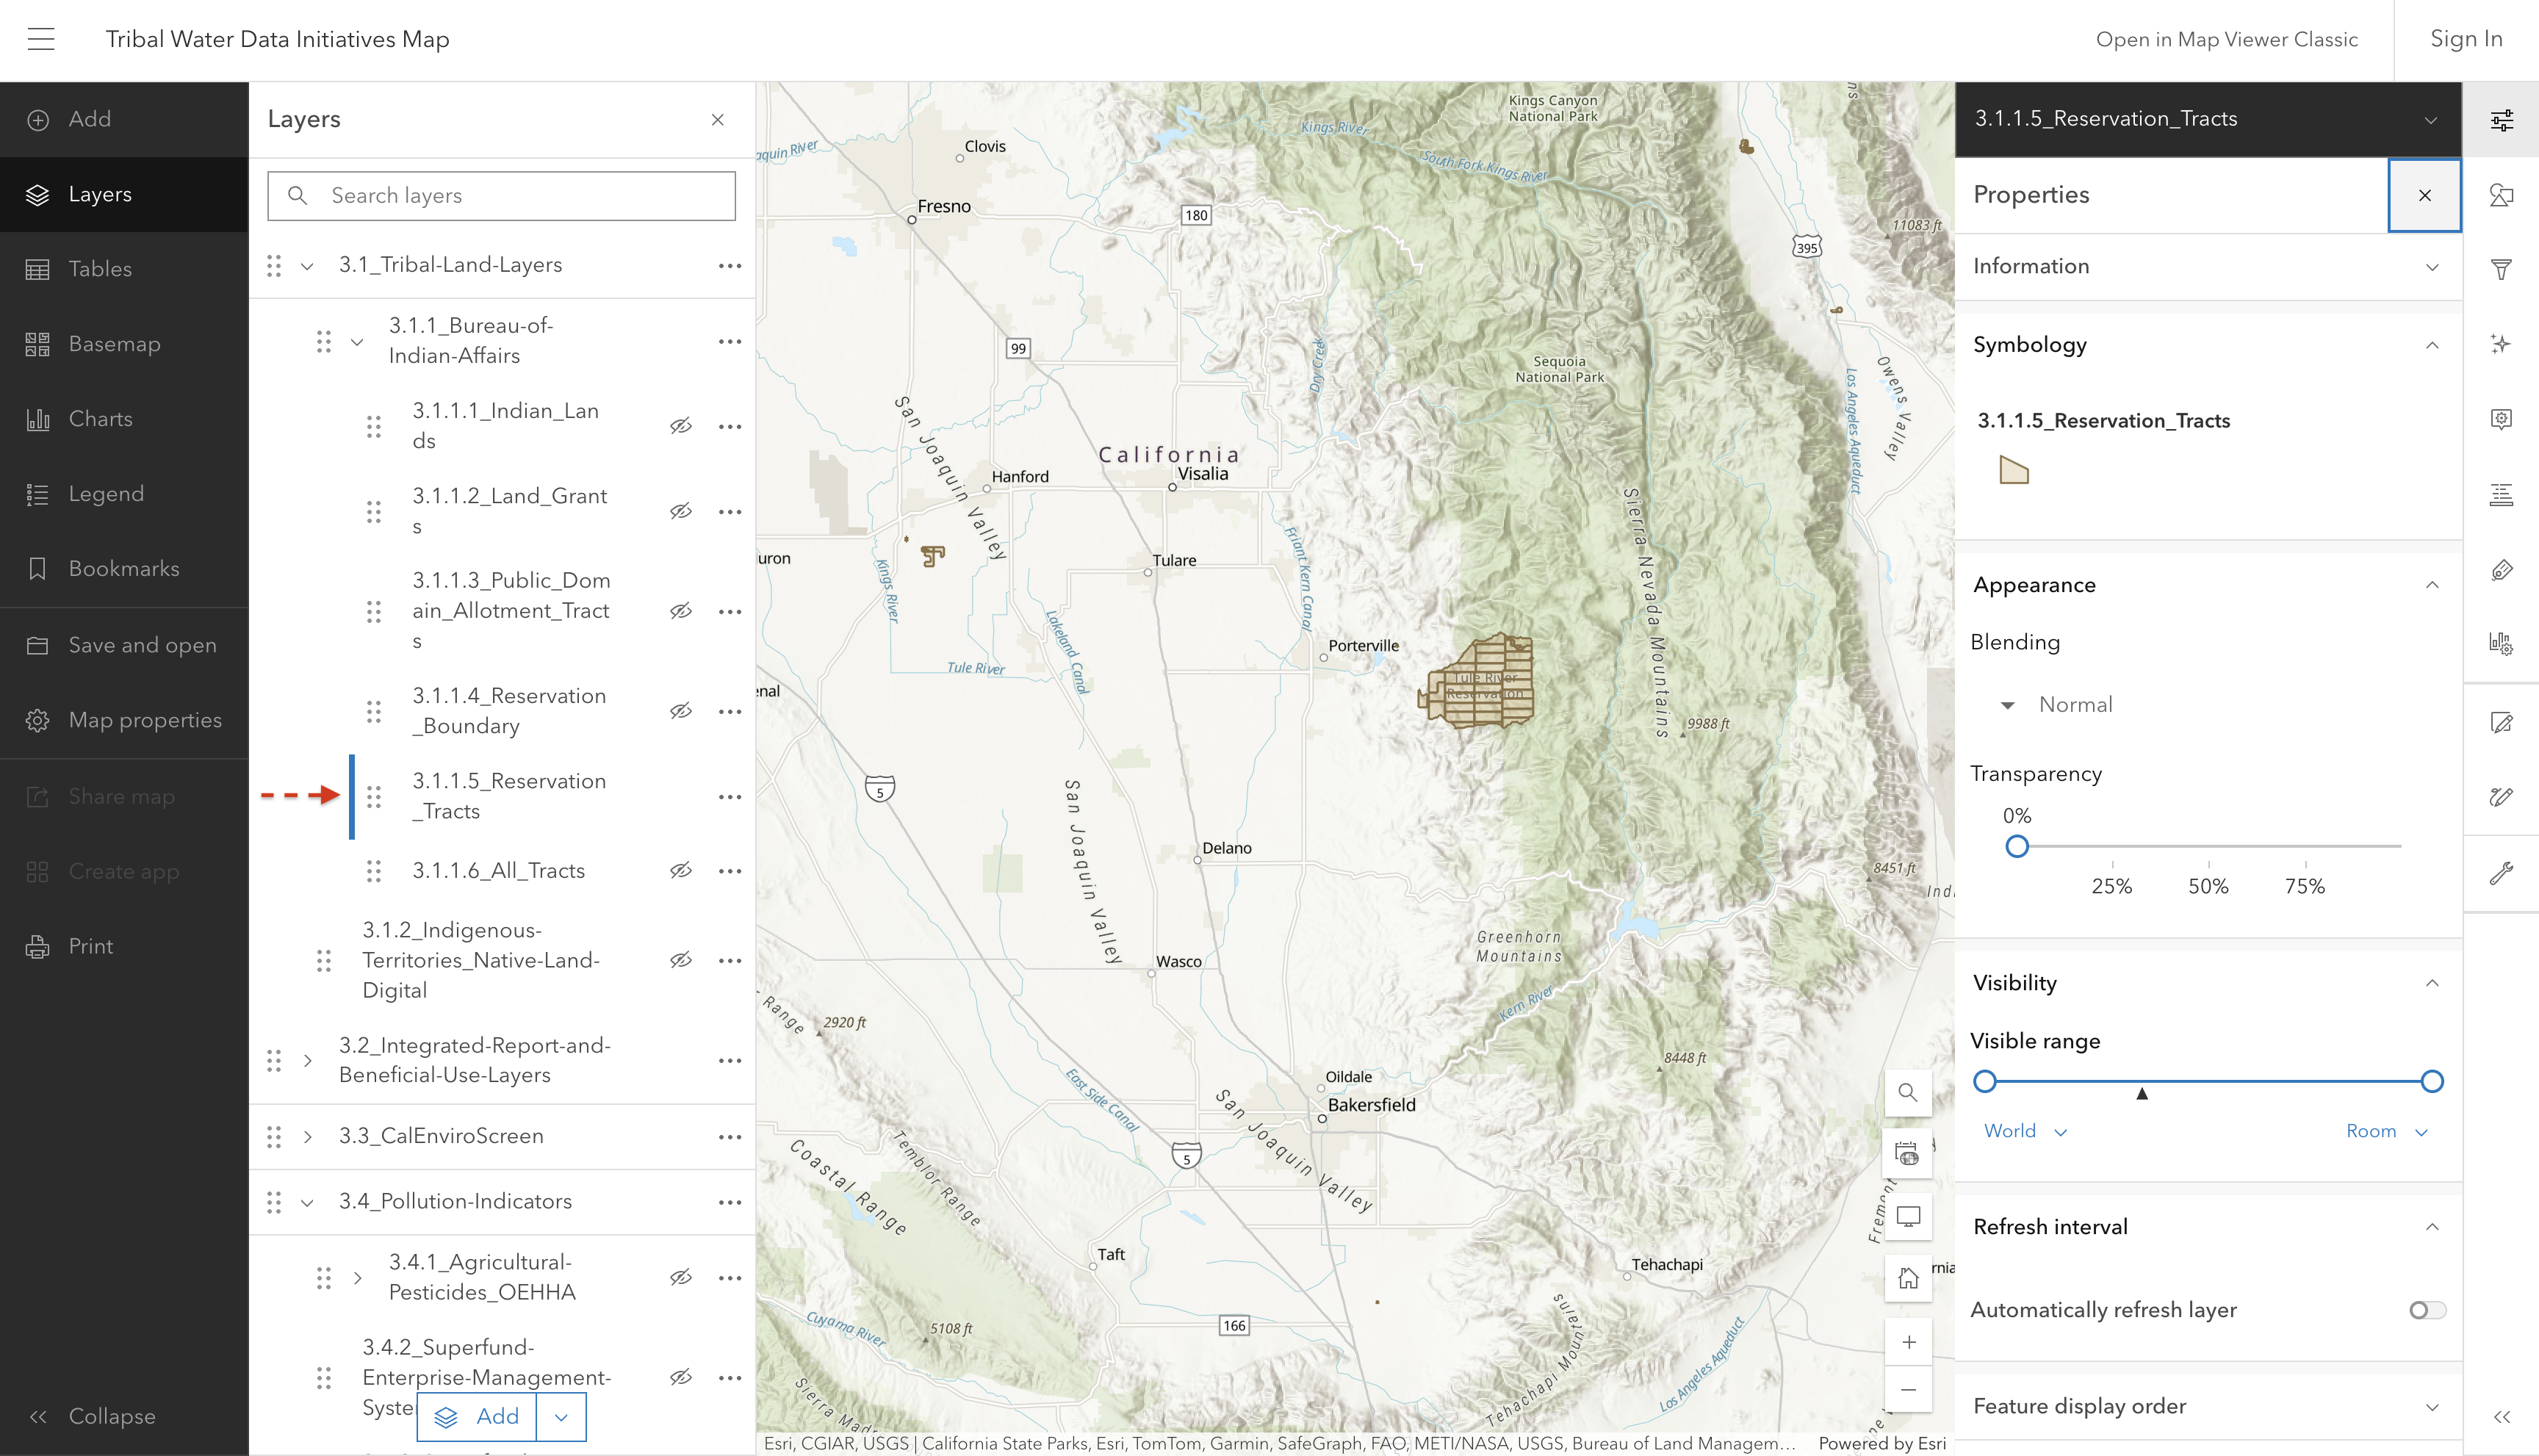
3.1.1.5 Reservation_Tracts

Screenshot of interactive map showing individual reservation tracts

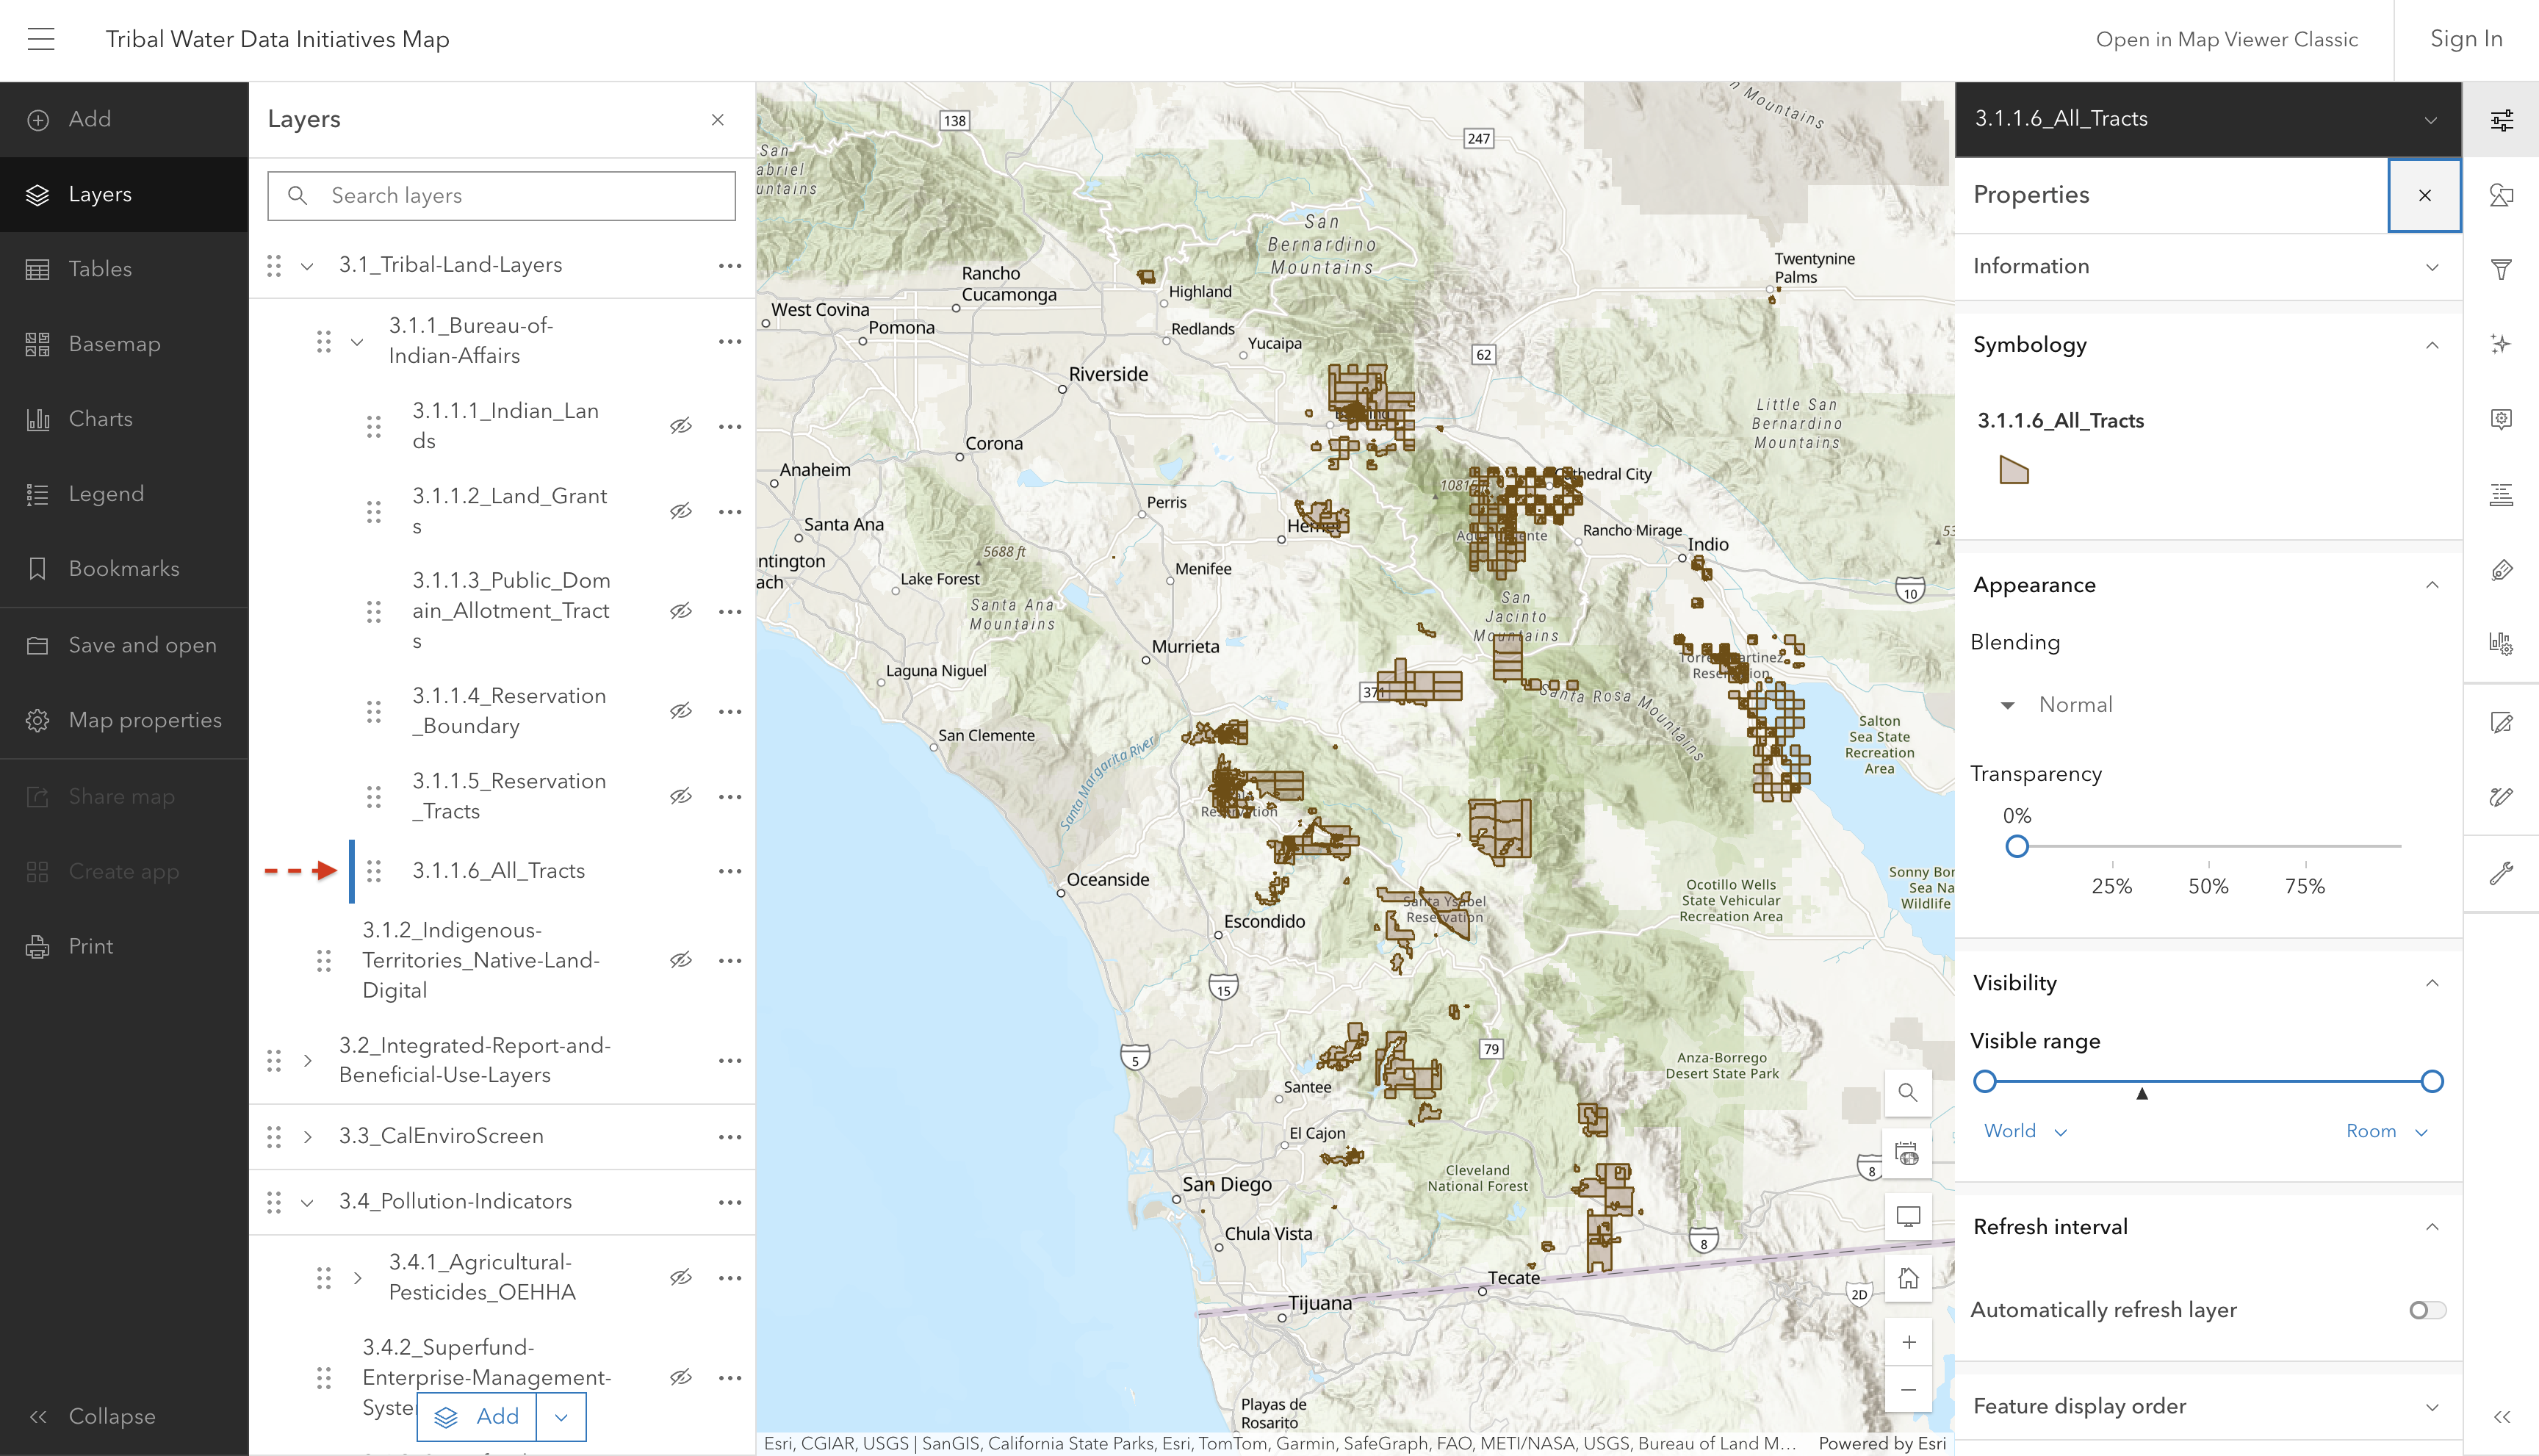
3.1.1.6 All_Tracts

Screenshot of interactive map showing all BIA land tracts

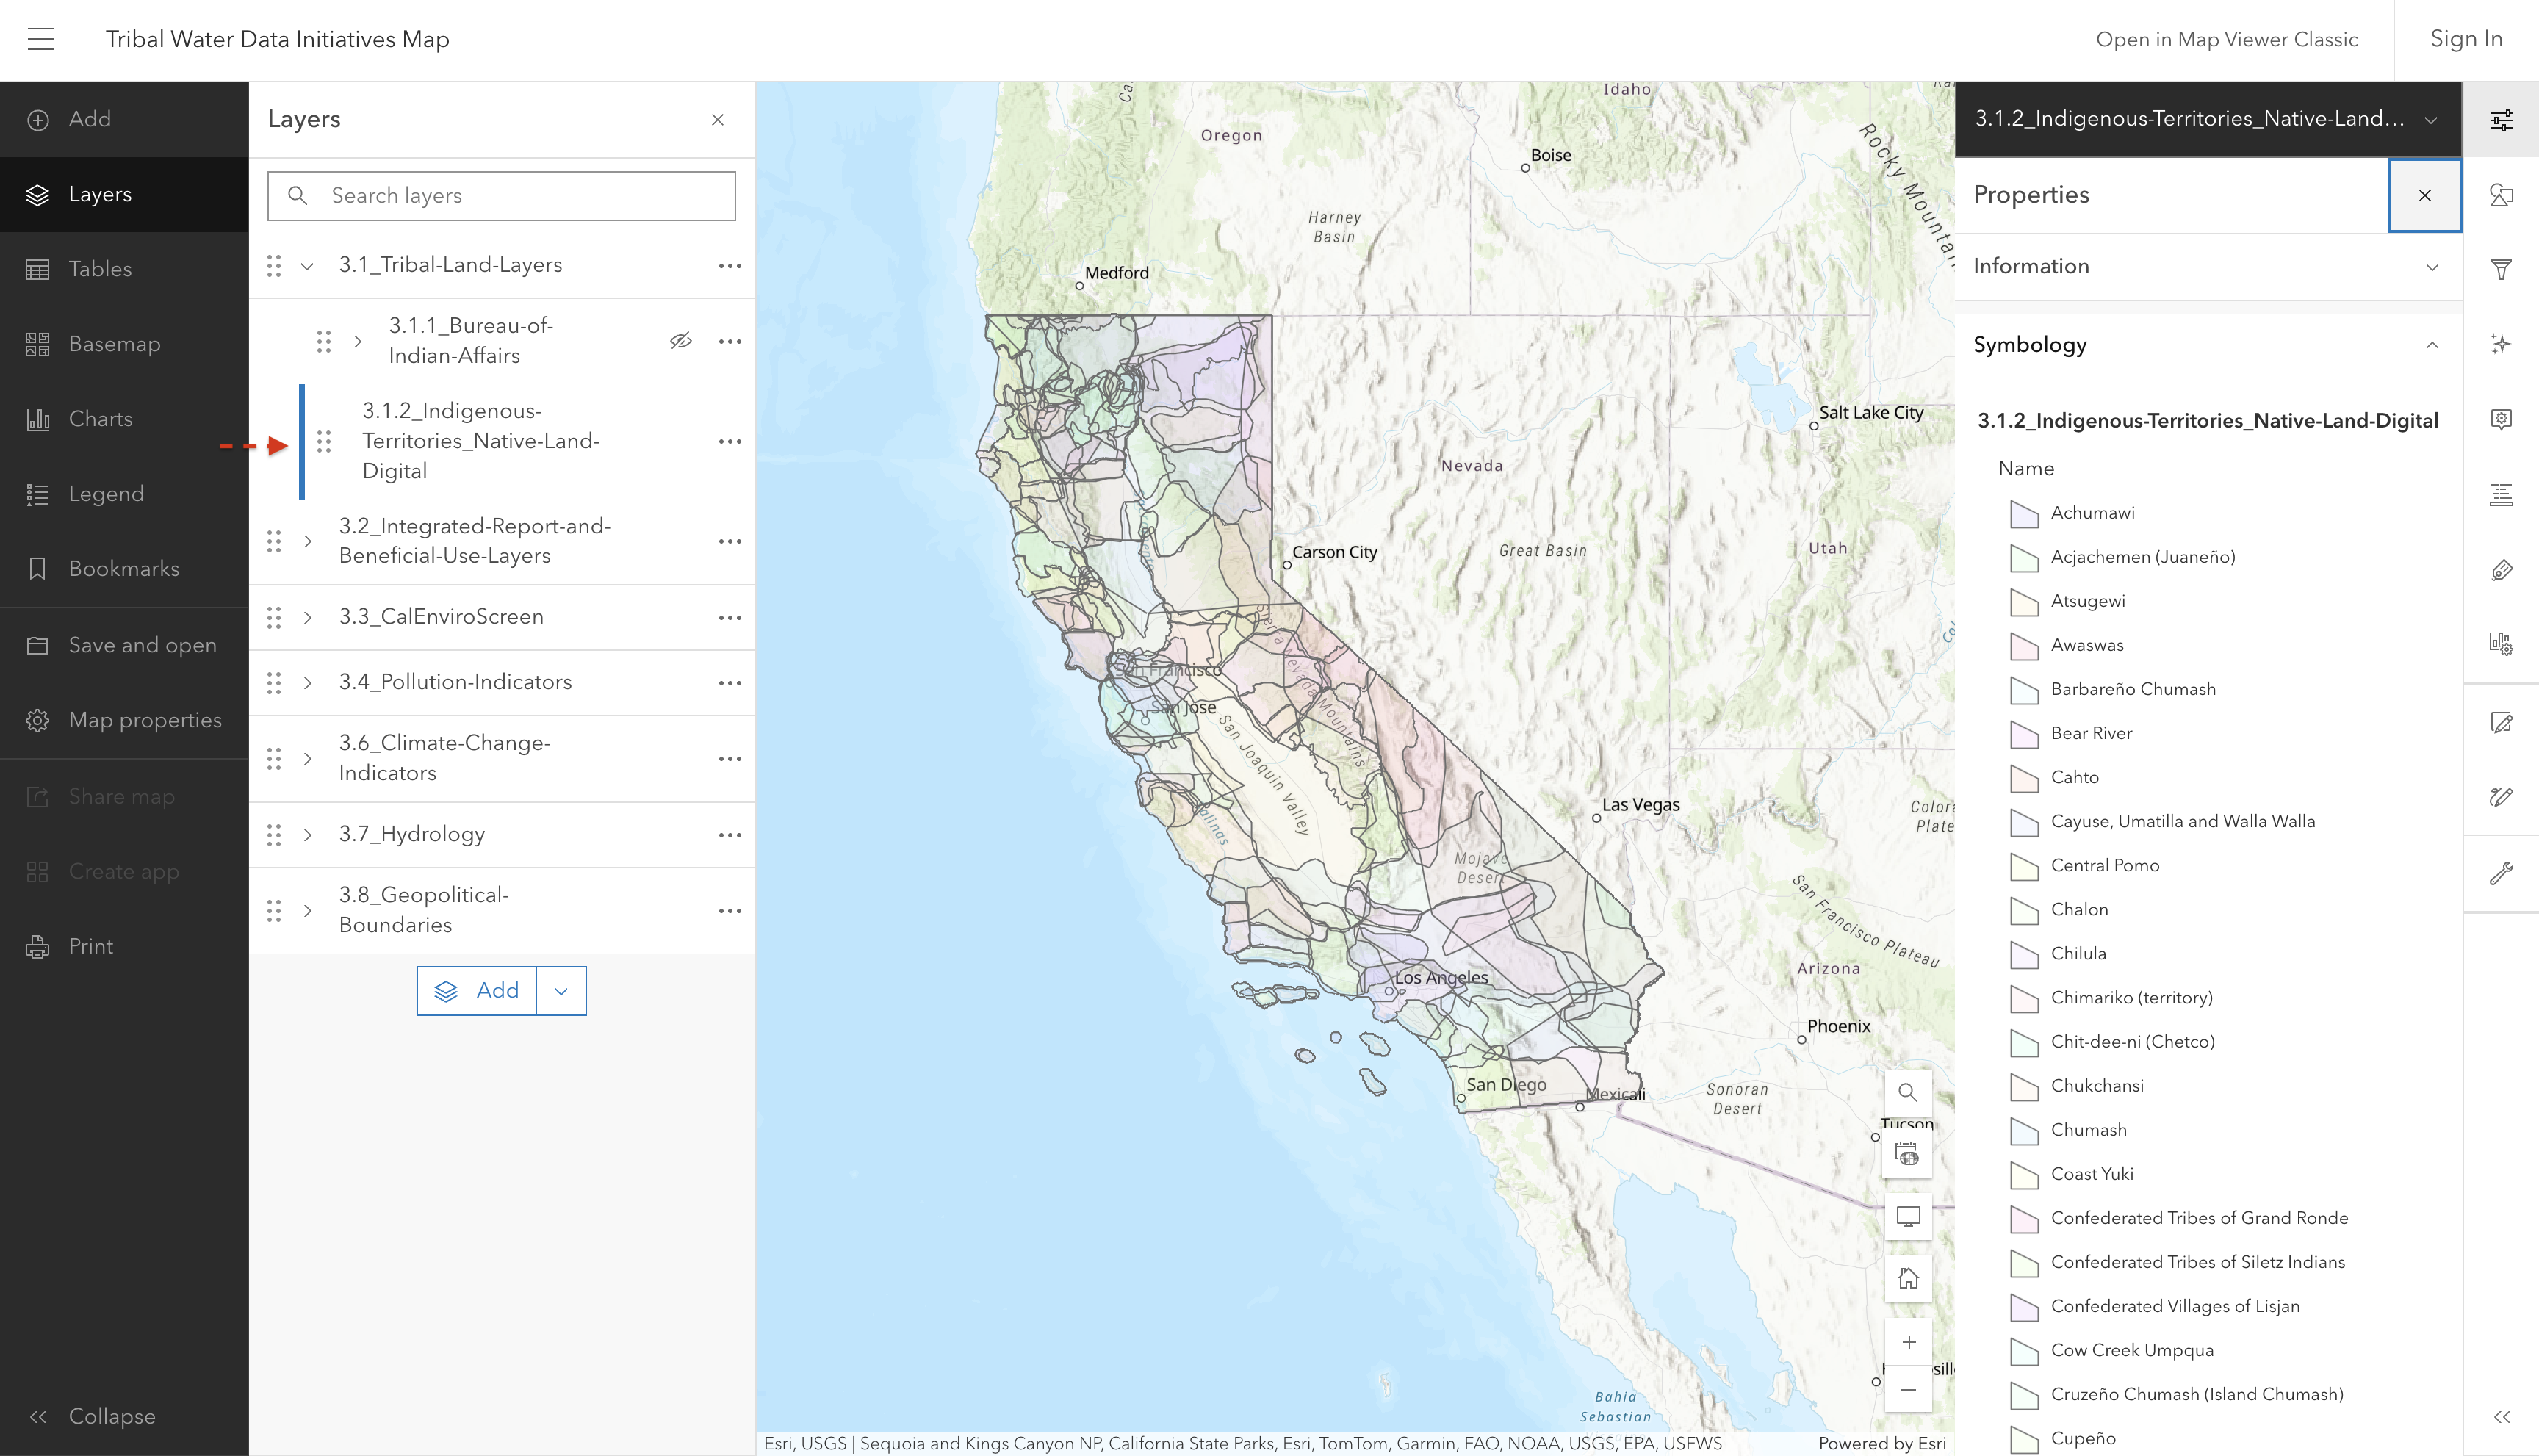
3.1.2 Indigenous Territories

Screenshot of interactive map showing historic Indigenous Territories

Layer displaying historic Indigenous Territories within California.

Source: Native Land Digital

Source update frequency: As needed

manually updated here June 2025

Contact: Native Land Digital

Native Land Digital “strives to create and foster conversations about the history of colonialism, Indigenous ways of knowing, and settler-Indigenous relations, through educational resources such as our map and Territory Acknowledgement Guide. We strive to go beyond old ways of talking about Indigenous people and to develop a platform where Indigenous communities can represent themselves and their histories on their own terms. In doing so, Native Land Digital creates spaces where non-Indigenous people can be invited and challenged to learn more about the lands they inhabit, the history of those lands, and how to actively be part of a better future going forward together.”

3.1.3 Other Sources of American Indian and Tribal Land

3.1.3.1 Tribal Census Tract 2021

Layer showing Tribal areas identified by the U.S. Census Bureau. You can zoom in further to see specific areas more closely.

Source: U.S. Census Bureau, TIGER/Line Shapefiles

Source update frequency: Every 10 years

automatically synced here

Contact: U.S Census Bureau

3.2 Integrated Report and Beneficial Use Layers

3.2.1 2024 Integrated Report

Note

What is the Integrated Report?

Waterbodies assessed in the Integrated Report (IR) include surface waterbodies, such as rivers, lakes, and beaches.

Assessed waterbodies are placed into one of five Integrated Report Condition Categories based on the waterbody’s ability to support beneficial use(s).

The 303(d) list consists of the waterbodies in Categories 4a, 4b, and 5. These waterbodies can be referred to as “listed” or “impaired”.

  • The 303(d) list is based off of Section 303(d) of the Clean Water Act, which requires each state to identify waters that do not meet water quality standards and to prioritize those waters for development of total maximum daily load (TMDL)

  • The Clean Water Act also requires each state to report on the overall condition of its surface waterbodies, which is Section 305(b).

California combines its 303(d) lists and 305(b) reports into a single “California Integrated Report”.

For more information see:

CEDEN - California Environmental Data Exchange Network

2024 Integrated Report | California State Water Resources Control Board

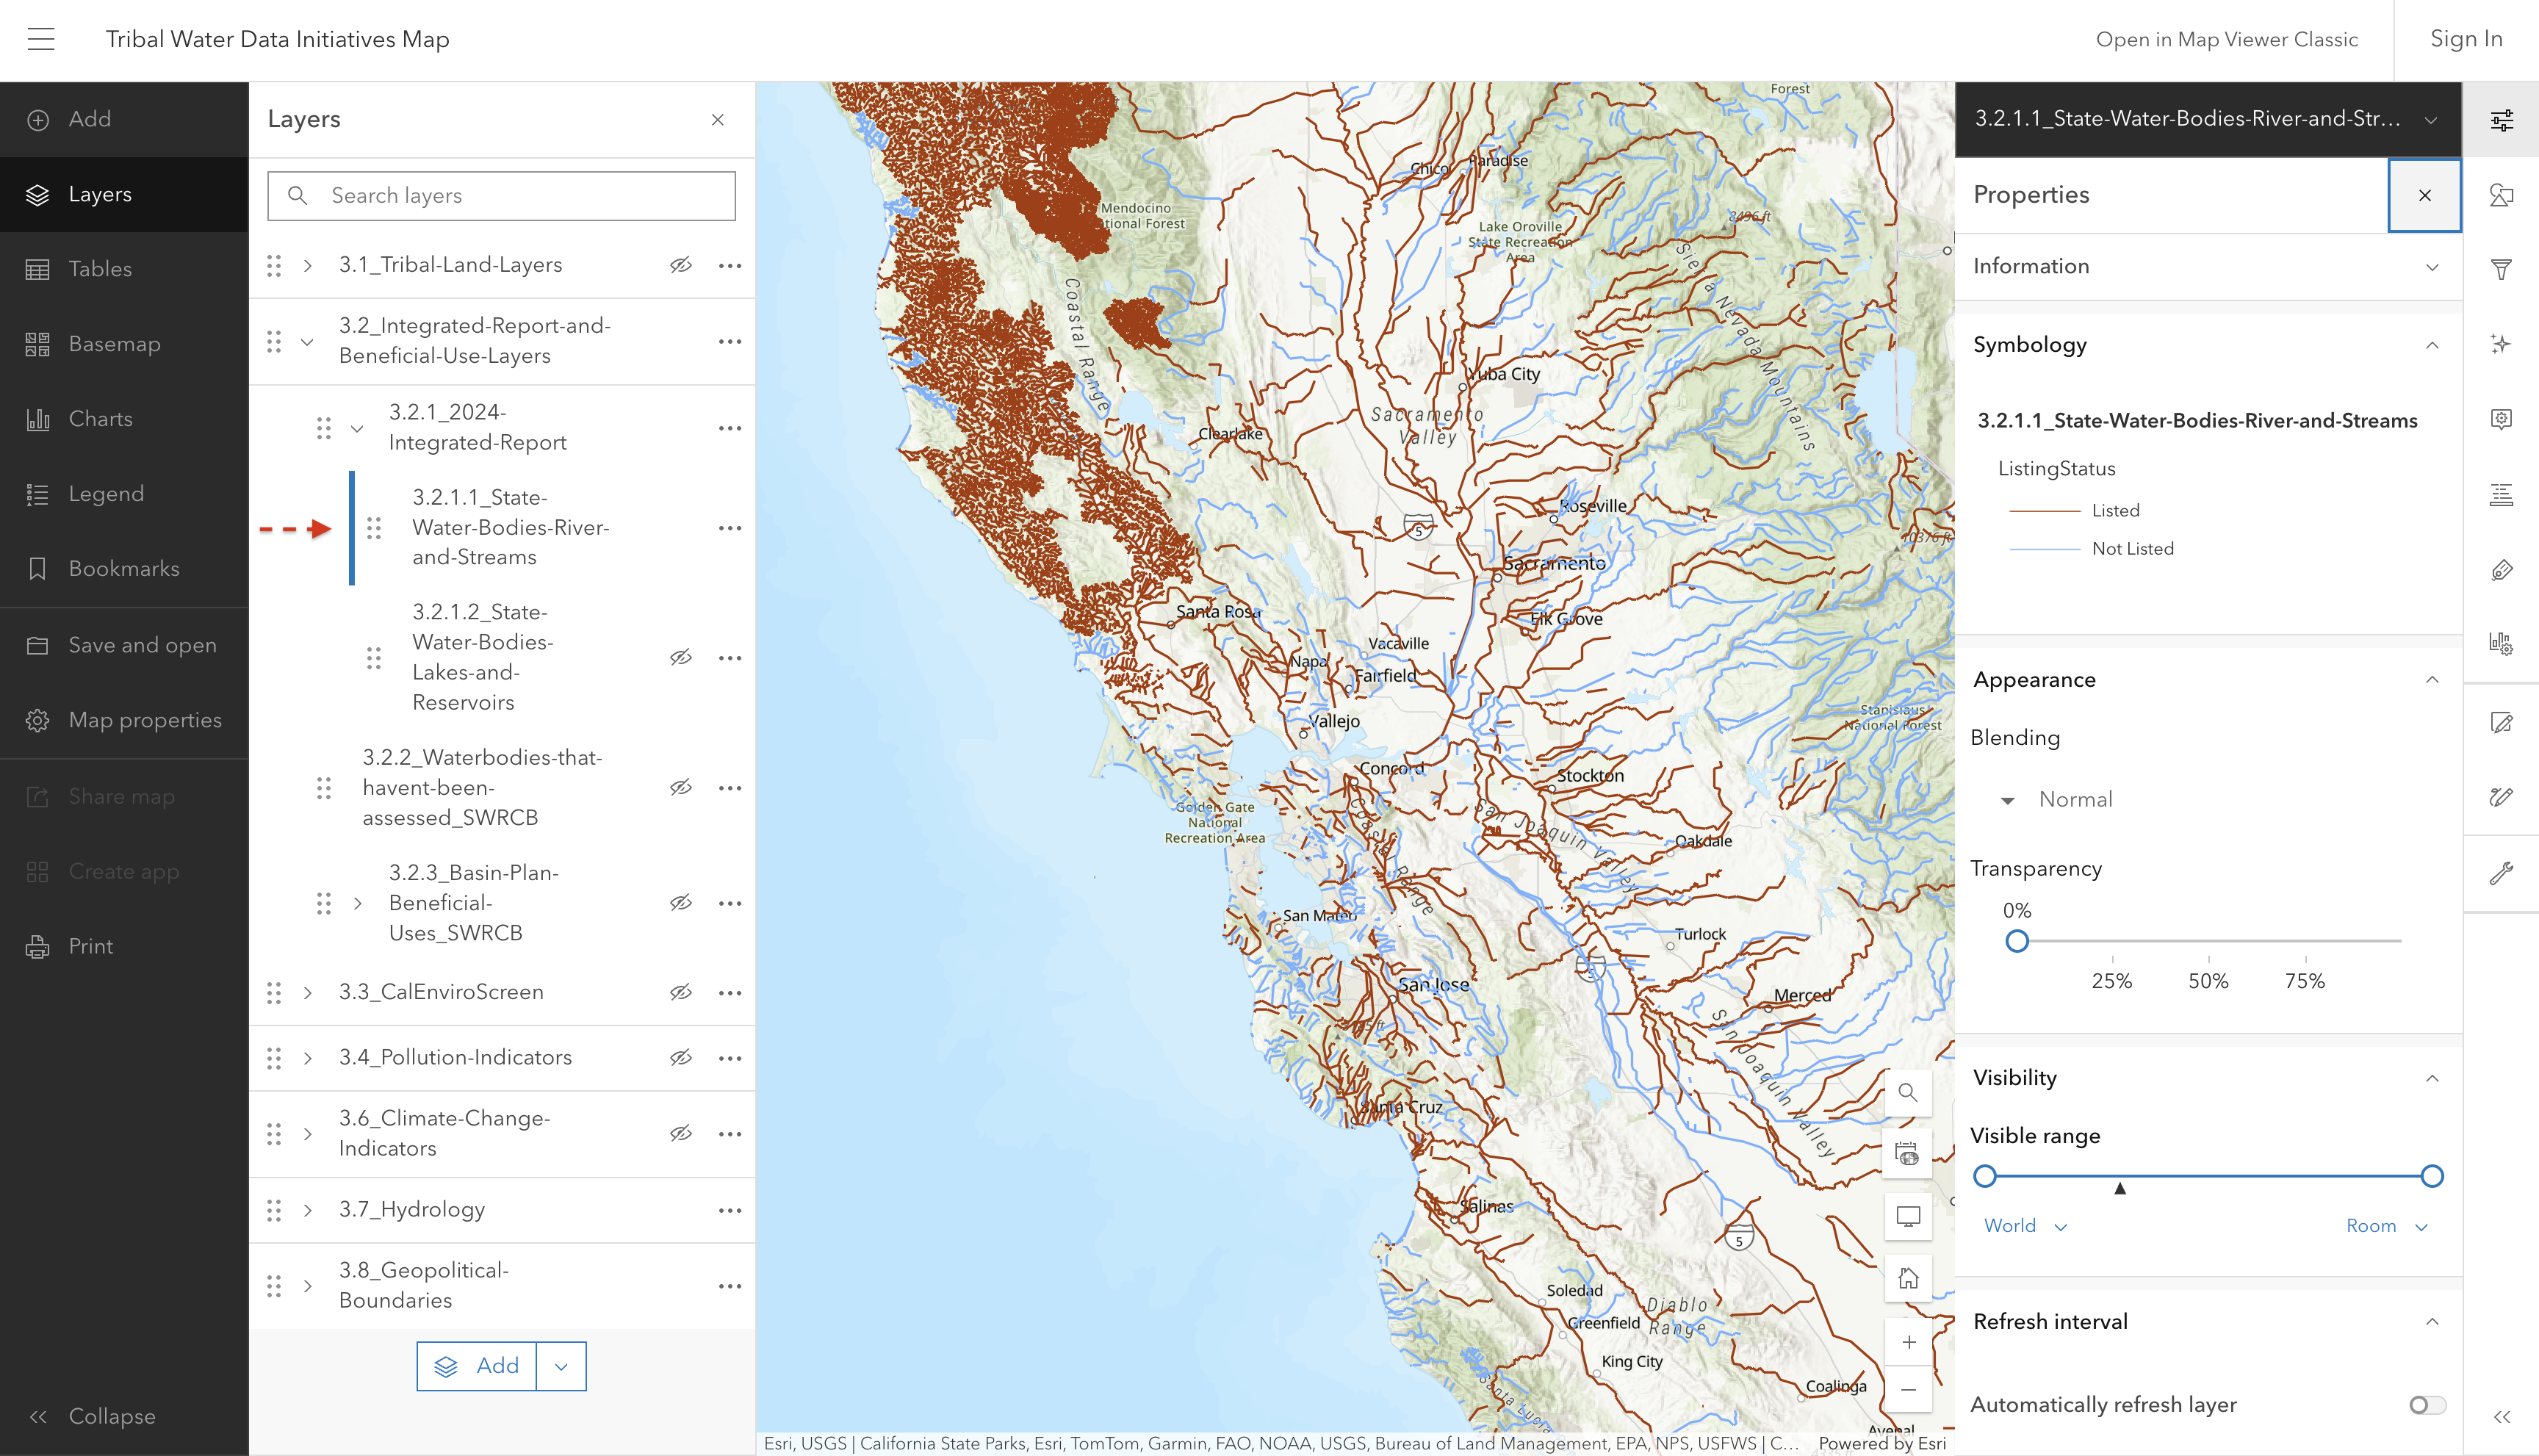
3.2.1.1 State Water Bodies (rivers, streams, and beaches)

NoteAdd new IR layer info

Update information to match map updates

This layer shows linear waterbodies in California, such as rivers, streams, and beaches, which were assessed for 305(b) in the 2022-2024 California Integrated Report. Blue waterbodies are listed in Category 1, 2, or 3. Orange waterbodies represent those placed on the 303(d) list of impaired waters.

Screenshot of interactive map showing the rivers and streams in the Integrated Report

Note, these are not the final assessments. 

Source: 2024 California Integrated Report

Source update frequency: Every 2 years

automatically synced here

Contact: SWRCB Water Quality Assessment Program

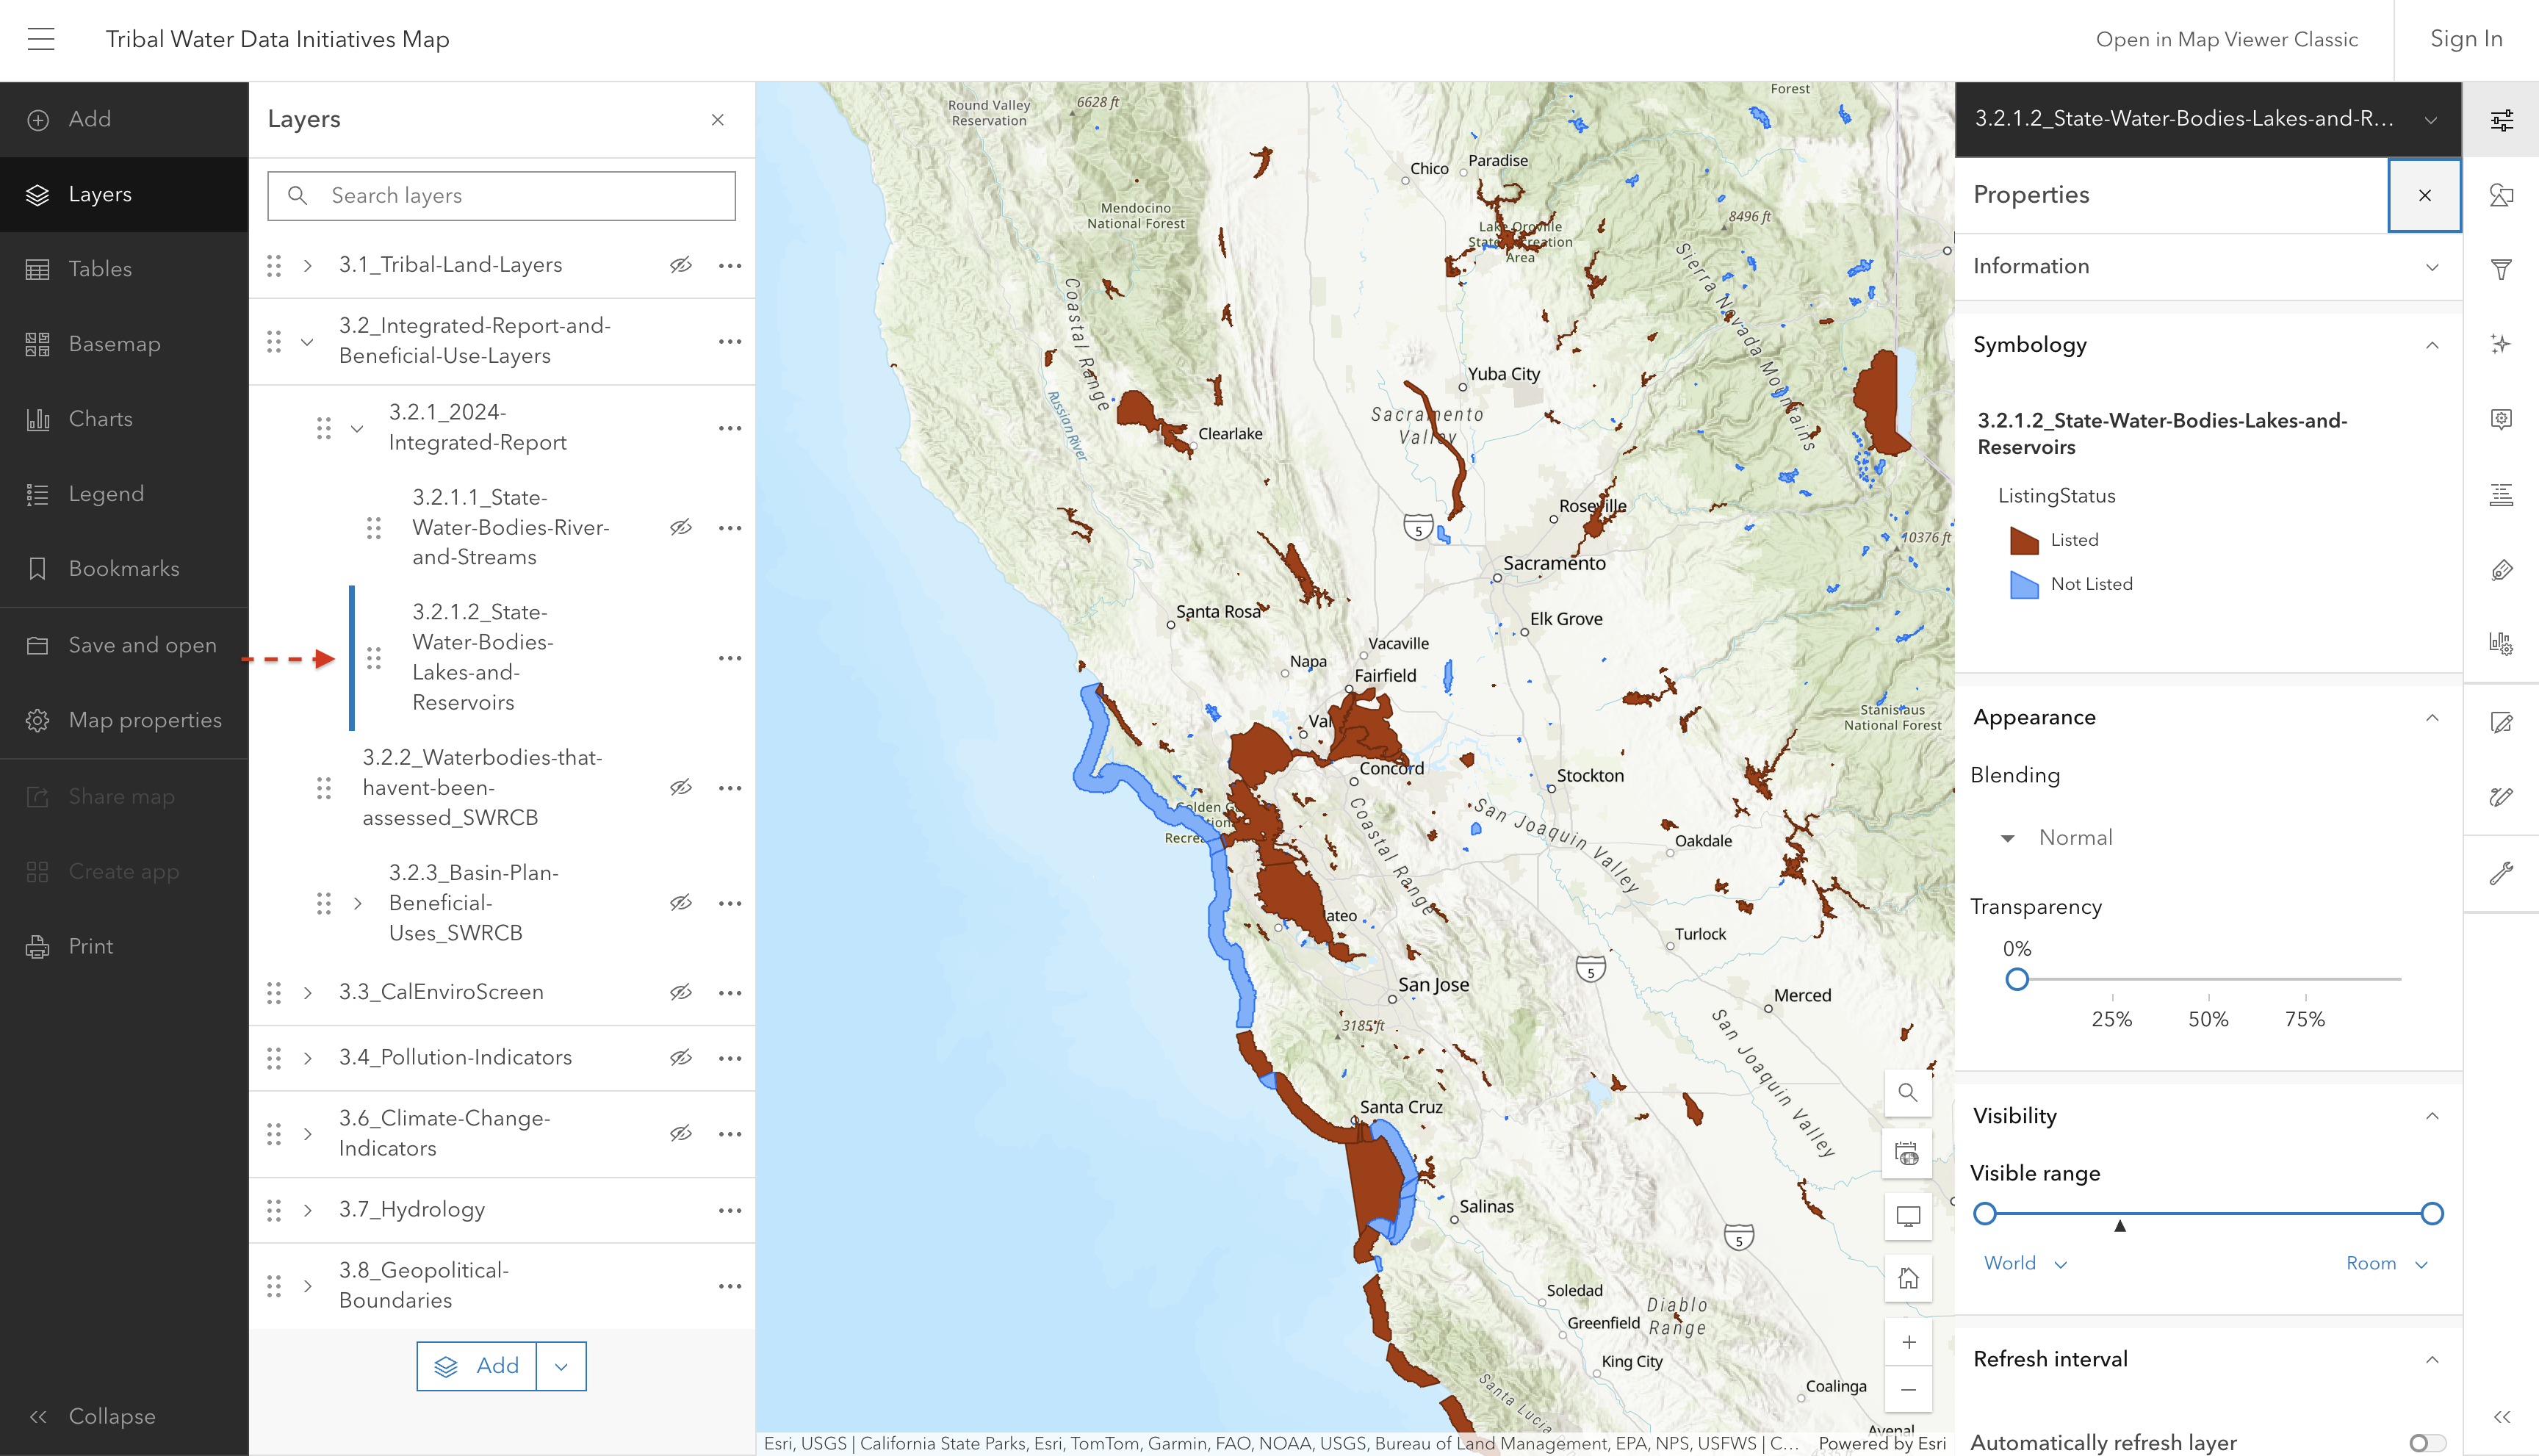
3.2.1.2 State Water Bodies (bays, lakes and reservoirs)

This layer shows non-linear (polygon) waterbodies in California, such as bays, lakes, and reservoirs, which were assessed for 305(b) in the 2020-2022 California Integrated Report. Blue waterbodies are listed in Category 1, 2, or 3. Orange waterbodies represent those placed on the 303(d) list of impaired waters.

Screenshot of interactive map showing the bays, lakes, and reservoirs in the Integrated Report

Note, these are not the final assessments. 

Source: 2024 California Integrated Report

Source update frequency: Every 2 years

automatically synced here

Contact: SWRCB Water Quality Assessment Program

3.2.2 Waterbodies with insufficient data

3.2.2.1 State Water Bodies (rivers, streams, and beaches)

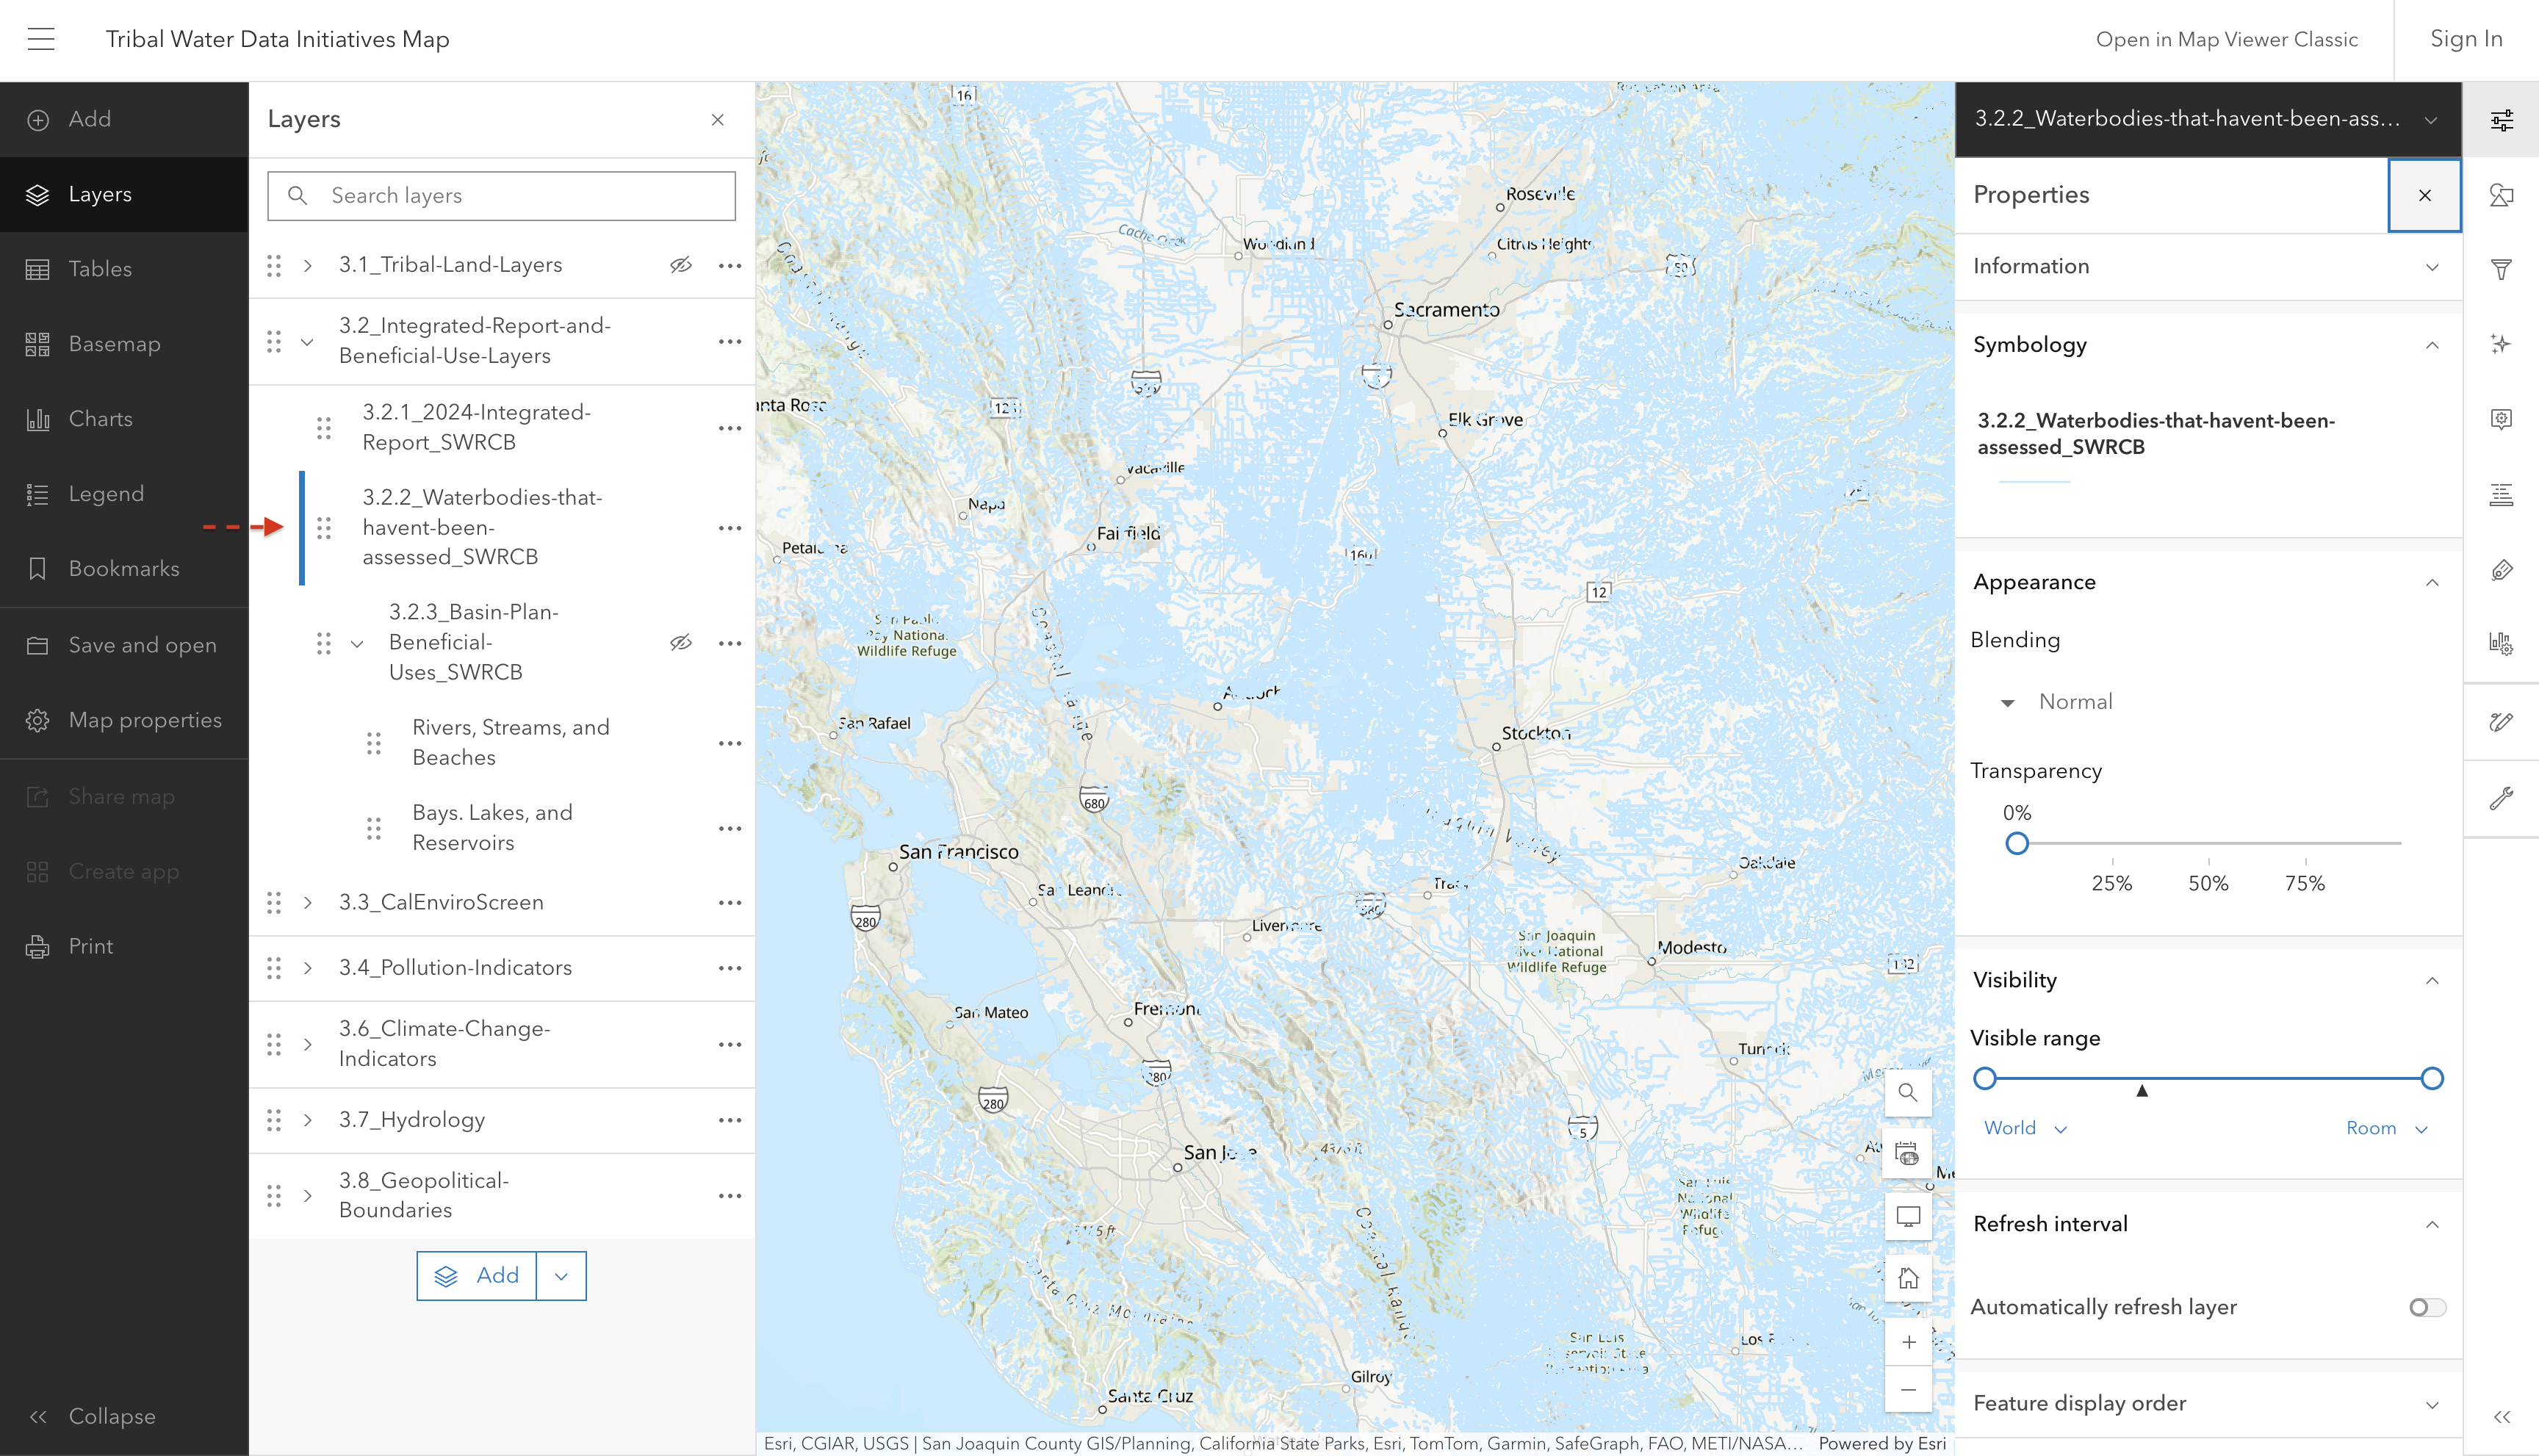
Screenshot of interactive map showing unassessed rivers, streams, and beaches

Source: National Hydrography Dataset

Source update frequency: Every 2 years

Note

This layer has not been updated since 2024 and therefore does not accurately reflect all waterbodies that have not been assessed. There are some waterbodies in the NHD layer that are not assessed in the IR layers. If you have further questions, please refer to the contact information below.

automatically synced here

Contact: California State Water Resources Control Board

3.2.2.2 State Water Bodies (bays, lakes and reservoirs)

this layer appears to now be in a combined rivers/streams/beaches + bays/lakes etc. layer

3.2.3 Basin Plan Beneficial Uses

Note

What are Beneficial Uses?

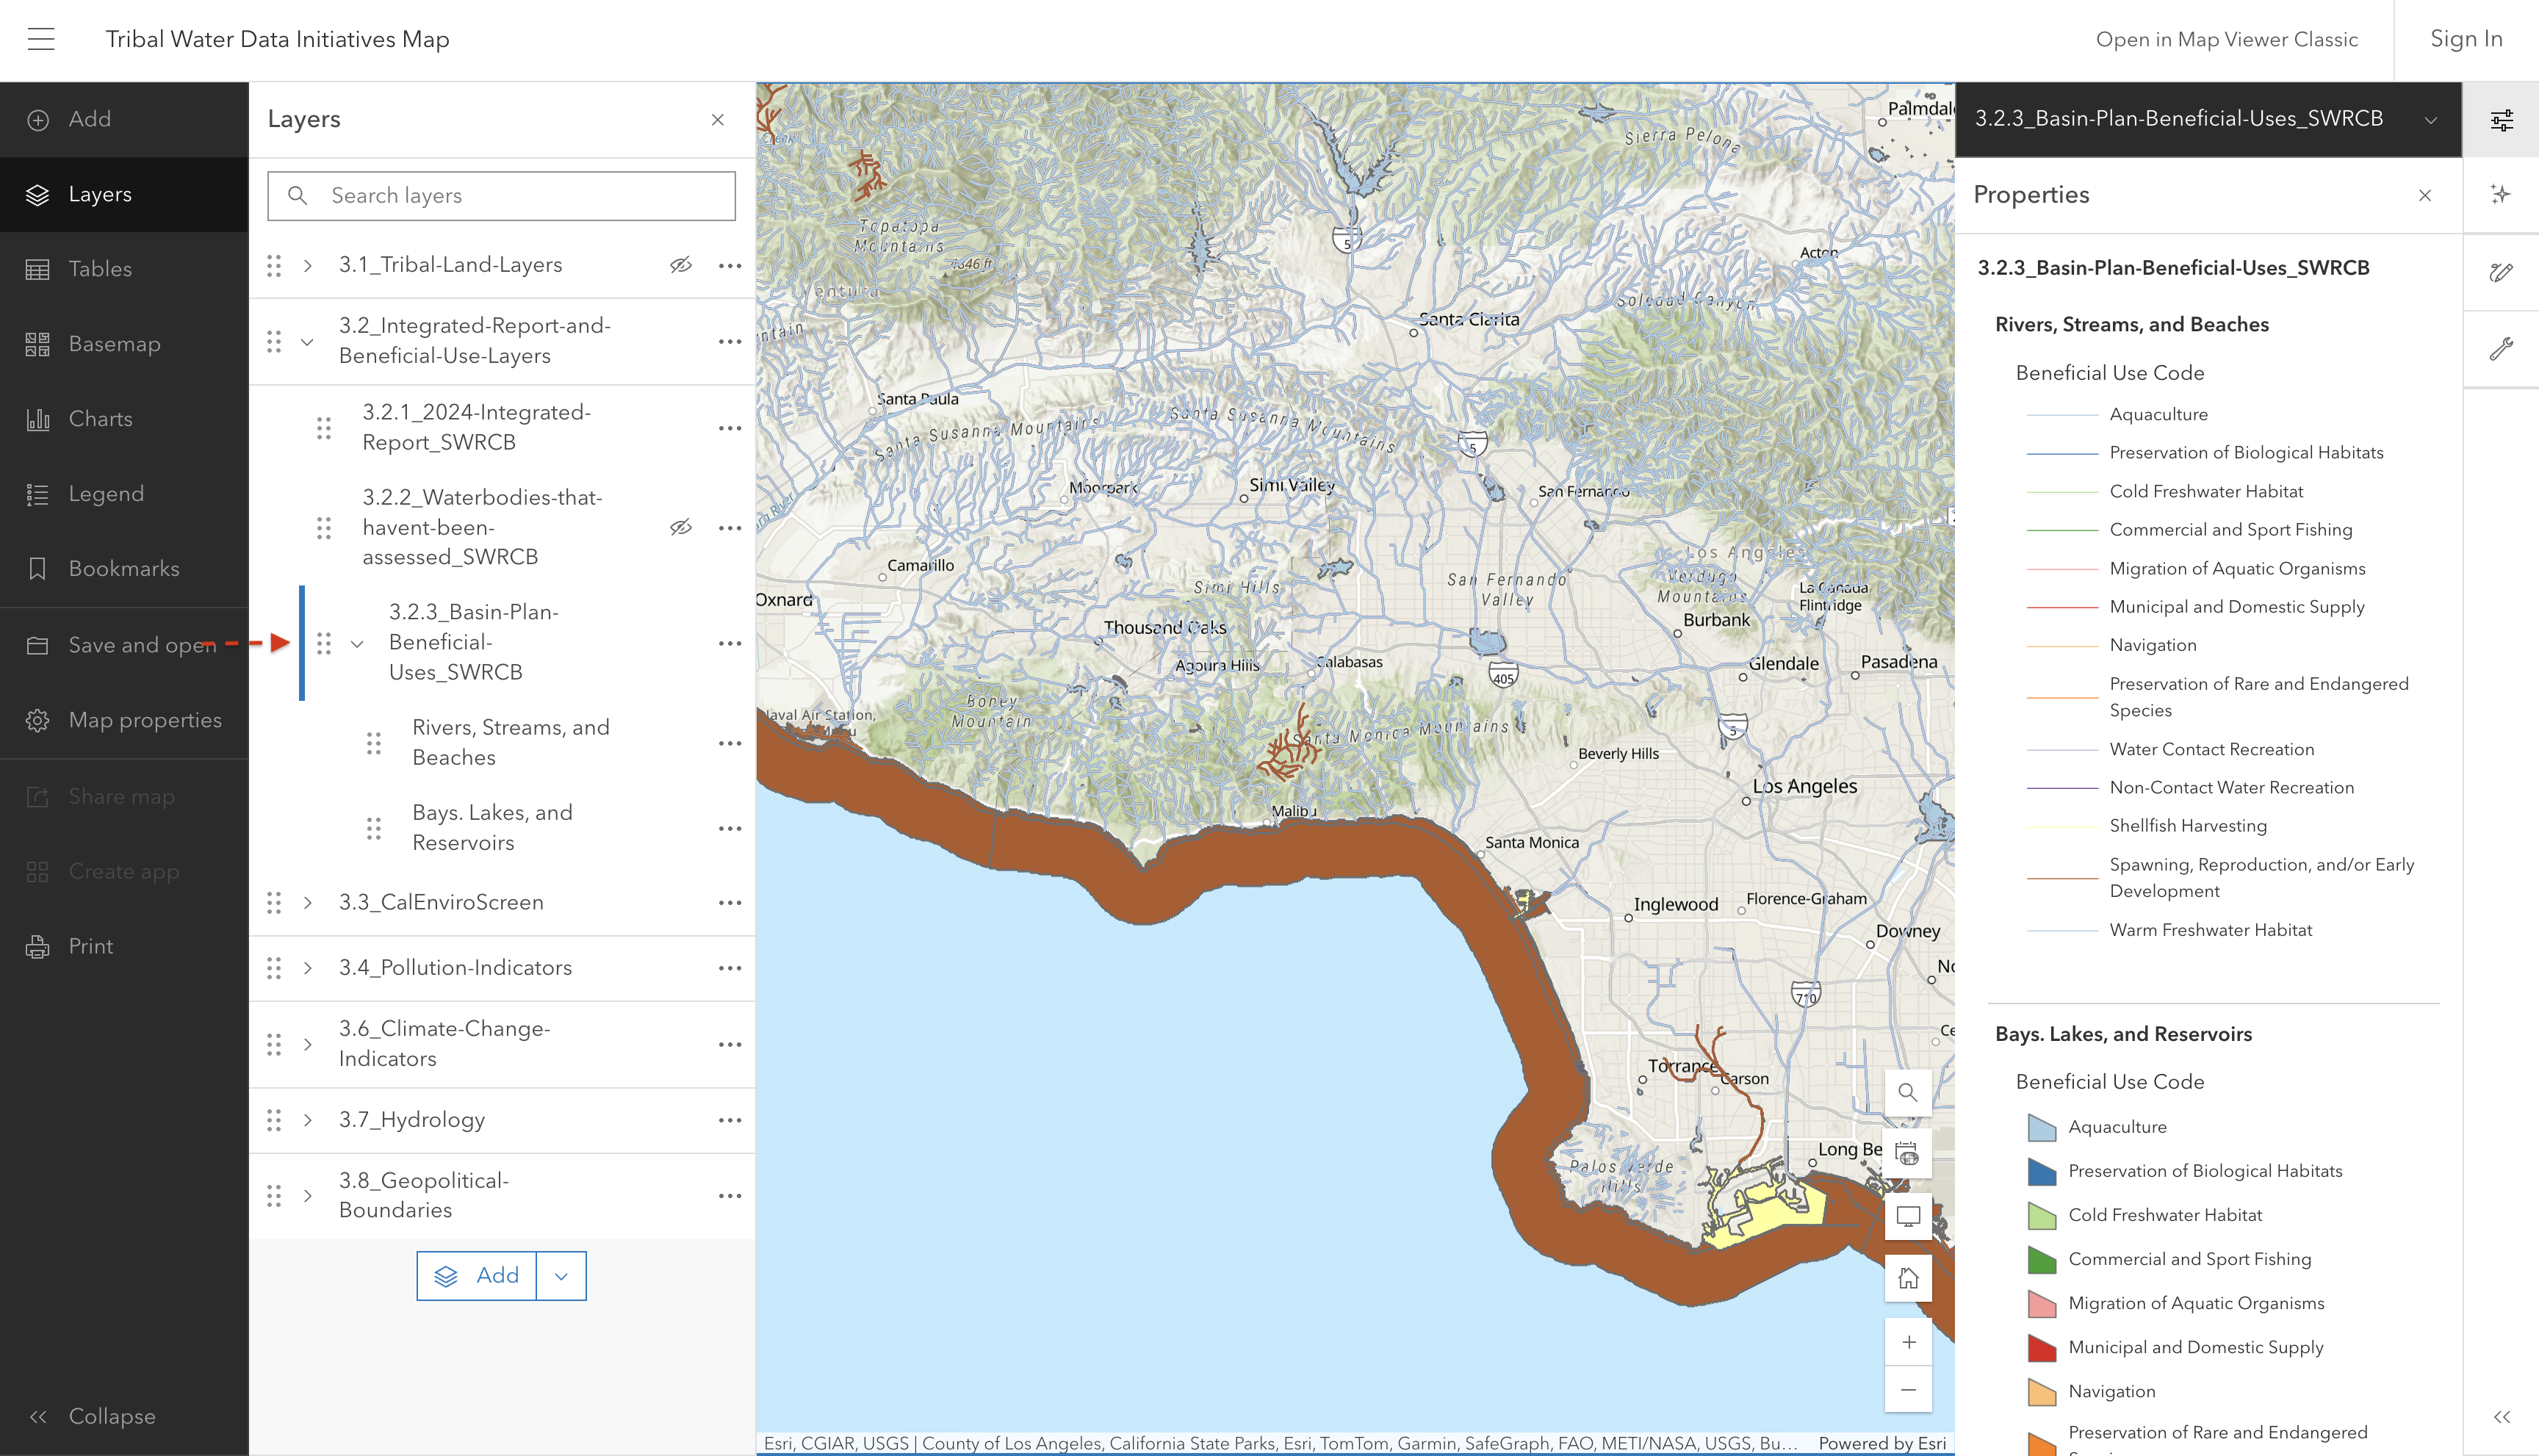
Waters that are used for specific purposes (see codes below or in layer properties on the map). These beneficial use waters are designated in regional water board water quality control plans.

Some examples of beneficial uses include: protection and propagation of fish, recreation, agriculture, etc. Waters are often designated with more than one beneficial use.

To ensure the protection of these waters and their beneficial uses, state and regional water quality control plans establish maximum levels of pollutants. When these maximum levels are exceeded and waters cannot support their designated beneficial uses, that is when they are listed as 303(d) or impaired waters.

Screenshot of interactive map showing Basin Plan Beneficial Uses

Source: CA State Water Resources Control Board - Basin Plan Portal

Source update frequency: ?

automatically synced here

Contact: CA State Water Resources Control Board - Basin Plan Portal

3.3 CalEnviroScreen

NoteWhat is CalEnviroScreen?

CalEnviroScreen is a science-based screening tool that is used to evaluate communities on both pollution exposure and population vulnerability in order to help identify areas that are disproportionately burdened by the cumulative impact of pollution and other environmental concerns. CalEnviroScreen evaluates pollution exposure and population vulnerability across 23 weighted indicators (such as drinking water contamination, asthma presence, etc.)  and generates a cumulative impact score for each census tract. For more information on the included indicators, see this page.

With longstanding research demonstrating that low-income communities and communities of color face higher exposure to environmental hazards, which is then exacerbated by higher social and economic burdens, the CalEnviroScreen score is intended to highlight these communities and direct investments and regulatory oversight to them.

If you are curious to learn more about CalEnviroScreen beyond the questions below, you can access the Office of Environmental Health Hazard Assessment training videos here.

NoteHow is the CalEnviroScreen Score calculated?

The CalEnviroScreen score uses Census Tract information and compares exposure levels, environmental effects, sensitive population information, and socioeconomic factors across all tracts. OEHHA converts raw data values for each indicator into a percentile to be able to compare results across the state.

After each indicator is assigned a percentage, OEHHA then calculates both the average of the exposure indicator percentiles and the average of the environmental effect percentiles. These two averages are then combined and divided by 10 to calculate the Pollution Burden score, which ranges from 0-10.

This same process is completed for the Population Characteristics, which combines the averages of the indicators for sensitive populations and socioeconomic factors.

The overall CalEnviroScreen score is then calculated by multiplying the Pollution Burden by the Population Characteristics, and ranges from 0-100. This method allows scores from across all census tracts in the state to be compared. A higher score means that a tract has a greater overall burden.

See Training Module 6 for more information and detailed examples.

3.3.1 CalEnviroScreen 5.0

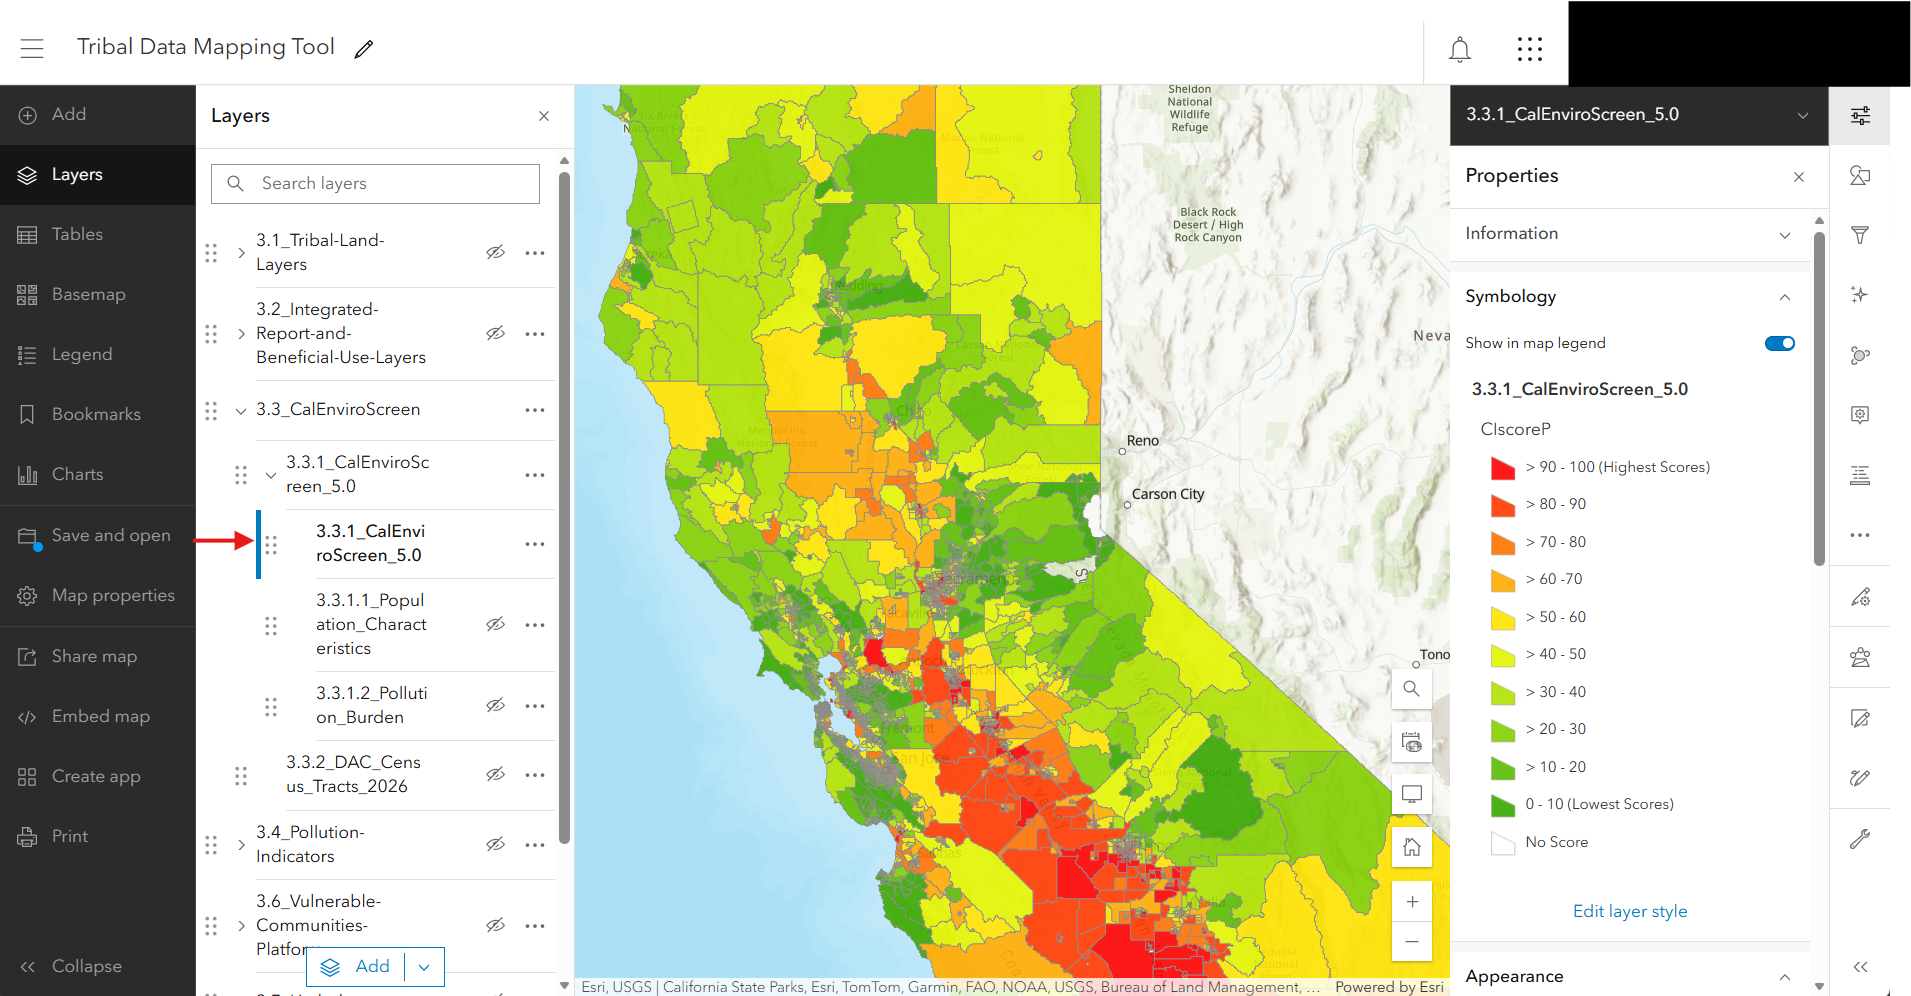
This layer shows the CalEnviroScreen (CES) 5.0, and is visualized based on the CES Score.

CalEnviroScreen is a screening methodology that can be used to help identify California communities that are disproportionately burdened by pollution and other environmental concerns. This value, also shown as the Ciscore on the map, ranges from 0 to 100 with higher values indicating higher burden. We show the census tracts with the highest scores in red, and the lowest in green. For more information on CalEnviroScreen scoring, see above.

CalEnviroScreen was recently updated from version 4.0 to 5.0, and this new version is now shown in the current Mapping Tool. Changes from CES 4.0 to 5.0 include updating the census geography from 2010 census tracts data to 2020, and including a few more indicators - such as diabetes prevalence and proximity to small air pollution sites.

Screenshot of interactive map showing CalEnviroScreen 5.0 percentile scores by census tract.

Screenshot of interactive map showing CalEnviroScreen 5.0 percentile scores by census tract.

Source: California Office of Environmental Health Hazard Assessment (OEHHA)

Source update frequency: As needed

automatically synced here

Contact: CalEnviroScreen

3.3.1.1 Population Characteristics

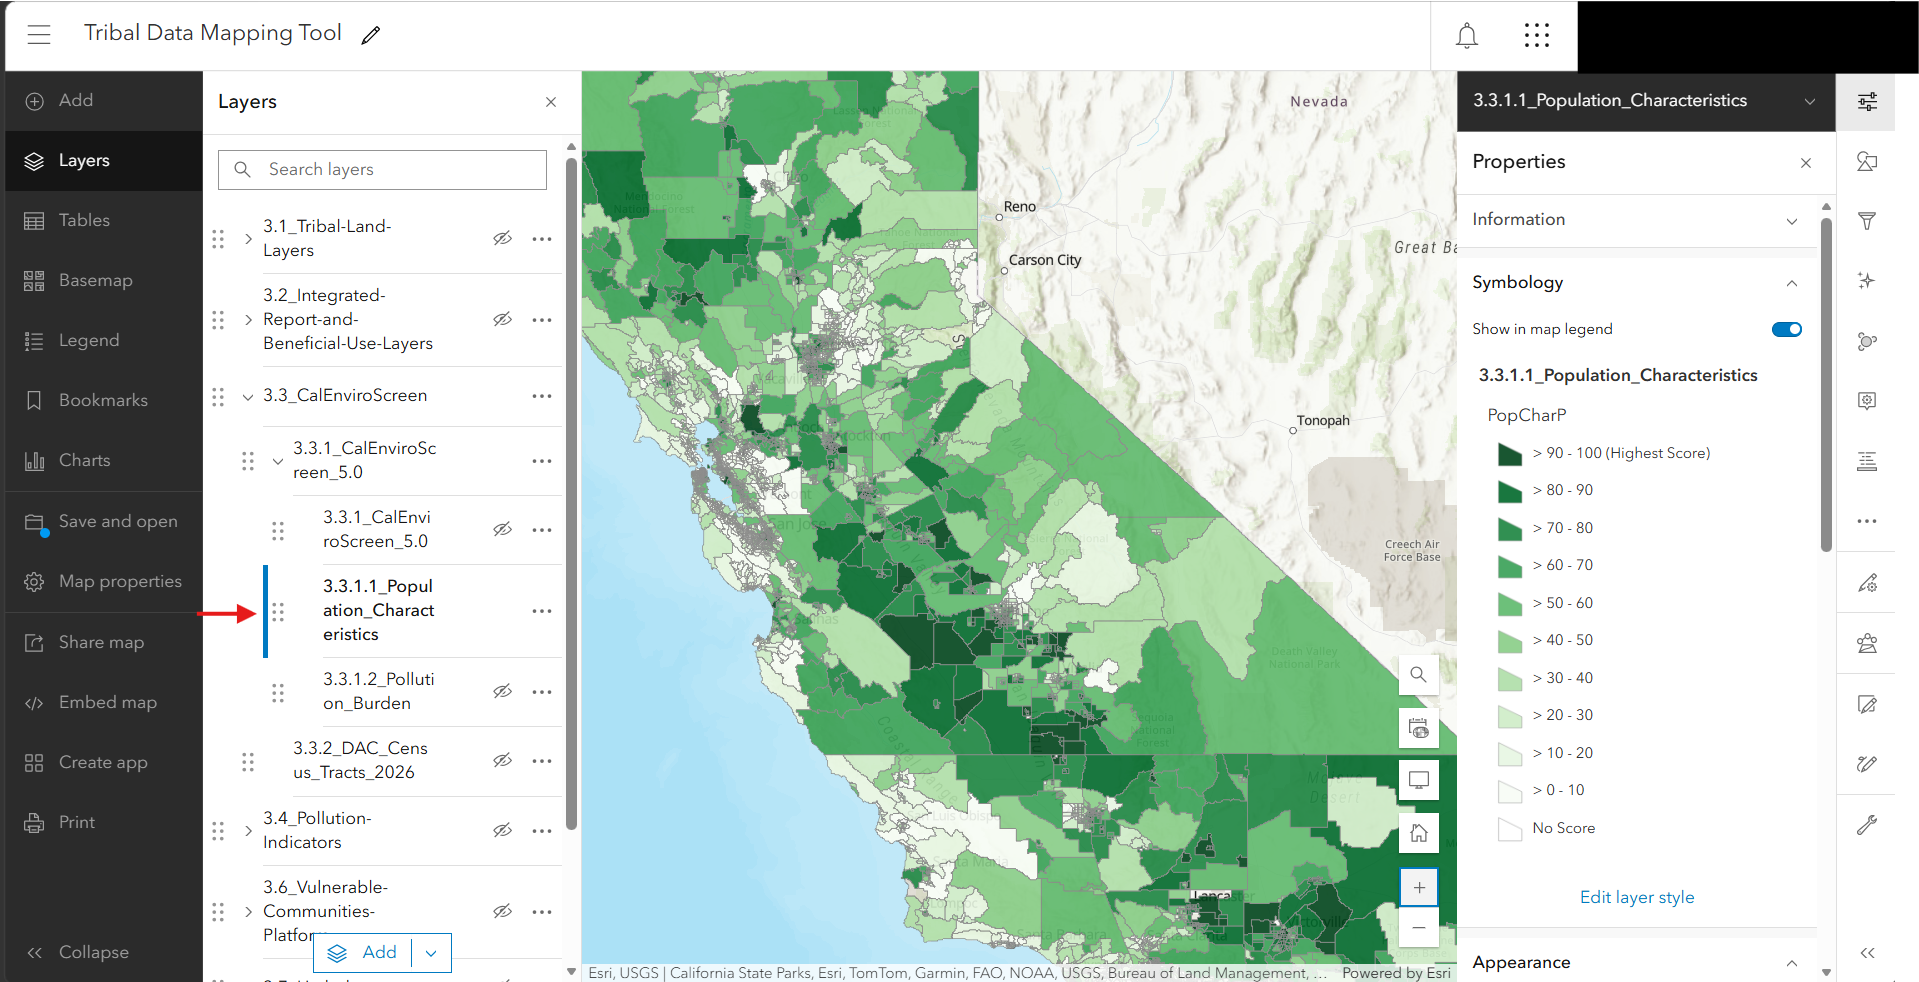
As described above, Population Characteristics is one component of the total CalEnviroScreen score and combines indicators regarding sensitive populations and socioeconomic factors. This score does not include any environmental impacts, and thus can be used to explore strictly social burdens across the state.

Screenshot of interactive map showing Pollution Burden scores by tract.

Screenshot of interactive map showing Pollution Burden scores by tract.

Source: California Office of Environmental Health Hazard Assessment (OEHHA)

Source update frequency: As needed

automatically synced here

Contact: CalEnviroScreen

3.3.1.2 Pollution Burden

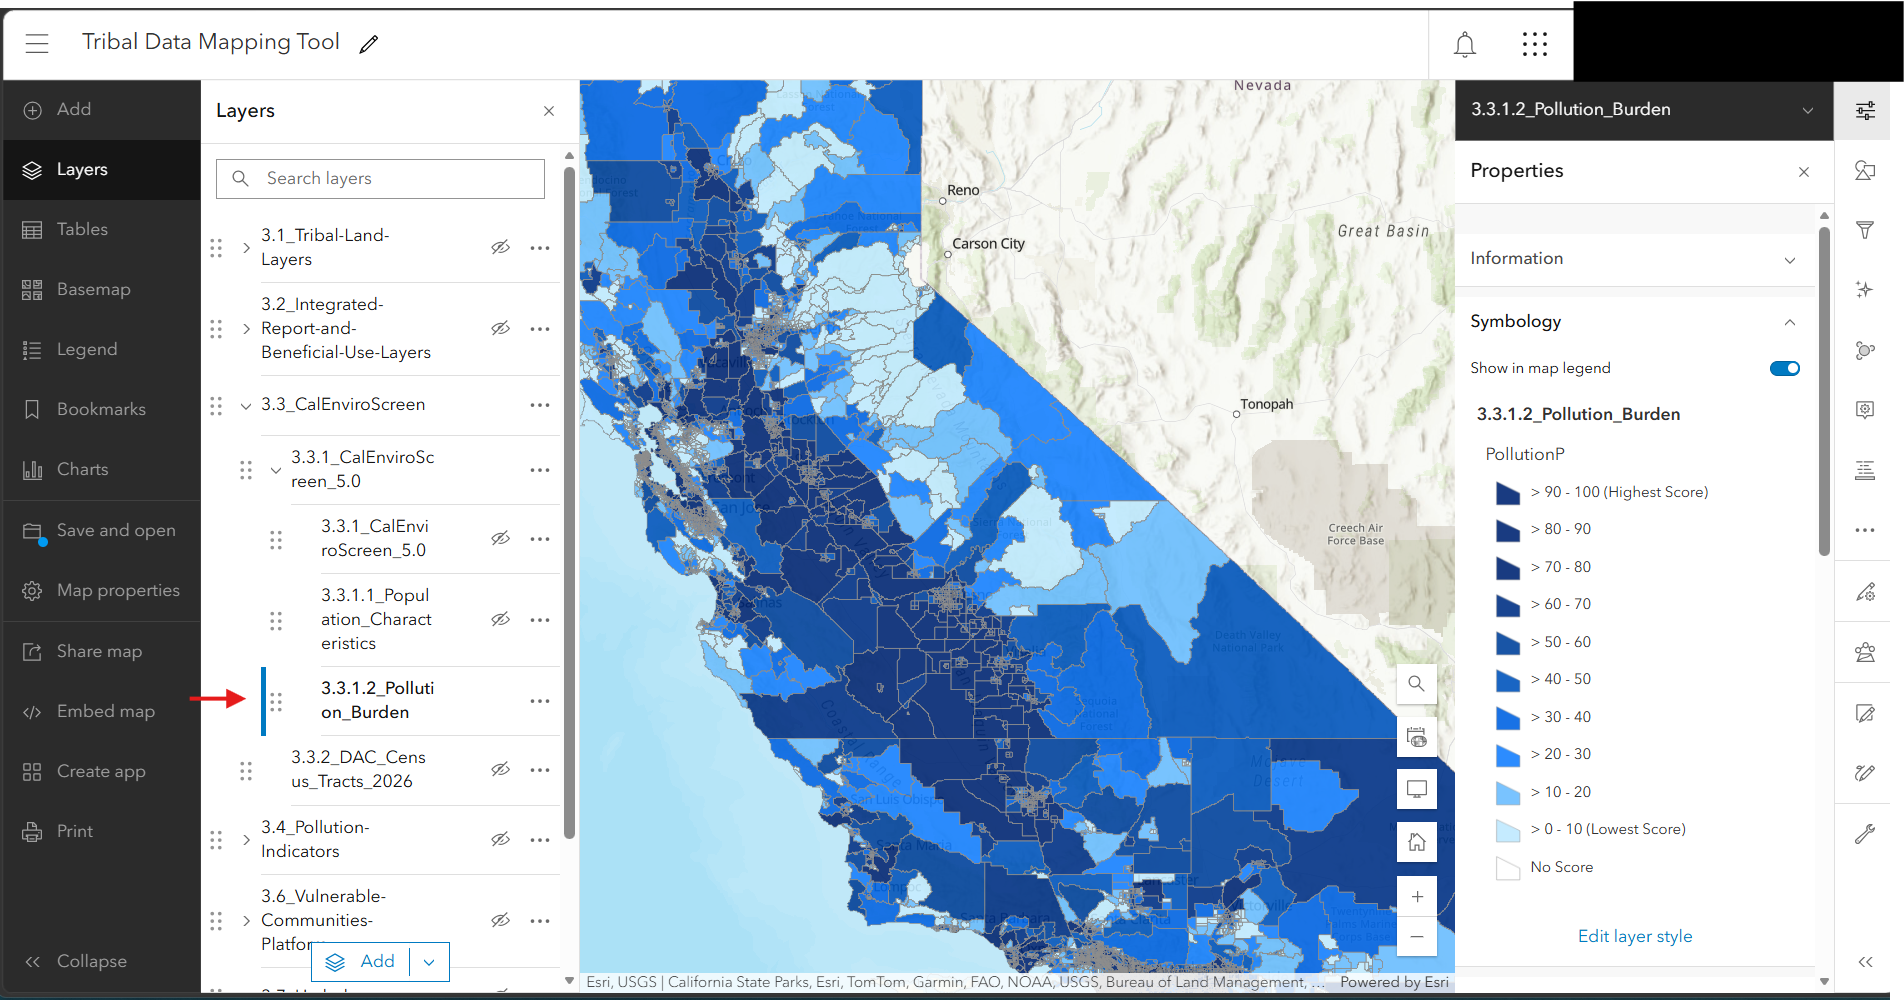
Pollution Burden the second aggregated component of the total CalEnviroScreen score and combines indicators regarding pollution exposure and environmental effects in general. It does not include any socioeconomic impacts, and thus this value can be used to explore strictly environmental burdens across the state. 

Screenshot of interactive map showing Pollution Burden scores by tract.

Screenshot of interactive map showing Pollution Burden scores by tract.

Source: California Office of Environmental Health Hazard Assessment (OEHHA)

Source update frequency: As needed

automatically synced here

Contact: CalEnviroScreen

NoteDiscussion of CalEnviroScreen

While useful as a broad indicator, there exists ongoing critiques and discussions surrounding the accuracy and limitations of CES and similar census-level screening metrics. CalEnviroScreen scores are incredibly financially consequential. The CalEnviroScreen value directs funding from public and private sources, and impacts eligibility for social services. The highest scoring neighborhoods are listed formally as Disadvantaged Communities, to which 25% of the proceeds of California’s cap-and-trade program are directed. As such, any efficacy or justice concerns with CalEnviroScreen can have major impacts on communities.

A consistent high level concern is the census-level nature of the CalEnviroScreen value. Since the unit of analysis is individual census tracts, these are much larger than natural divisions in communities. With a long-standing history of gentrification in San Francisco and other urban areas, increasingly wealthy neighborhoods exist in close proximity to economically disadvantaged communities which can skew the economic vulnerability metrics when examined at a larger scale. (See article from the San Francisco Public Press released in July 2026 regarding disadvantaged community designation changes from CalEnviroScreen 4.0 to 5.0)

Other critiques include the sensitivity of CalEnviroScreen to model specifications, which are often changed between model versions. A recent scientific paper published in Nature found that 16% of all census tracts could change designations based on very small alterations to the model, which is more alarming given that only 25% of census tracts are allocated a designation. Awareness of model limitations and subjectivity is critical as we continue to adapt these combined-metric models and understand ongoing changes.

3.3.2 Disadvantaged Communities

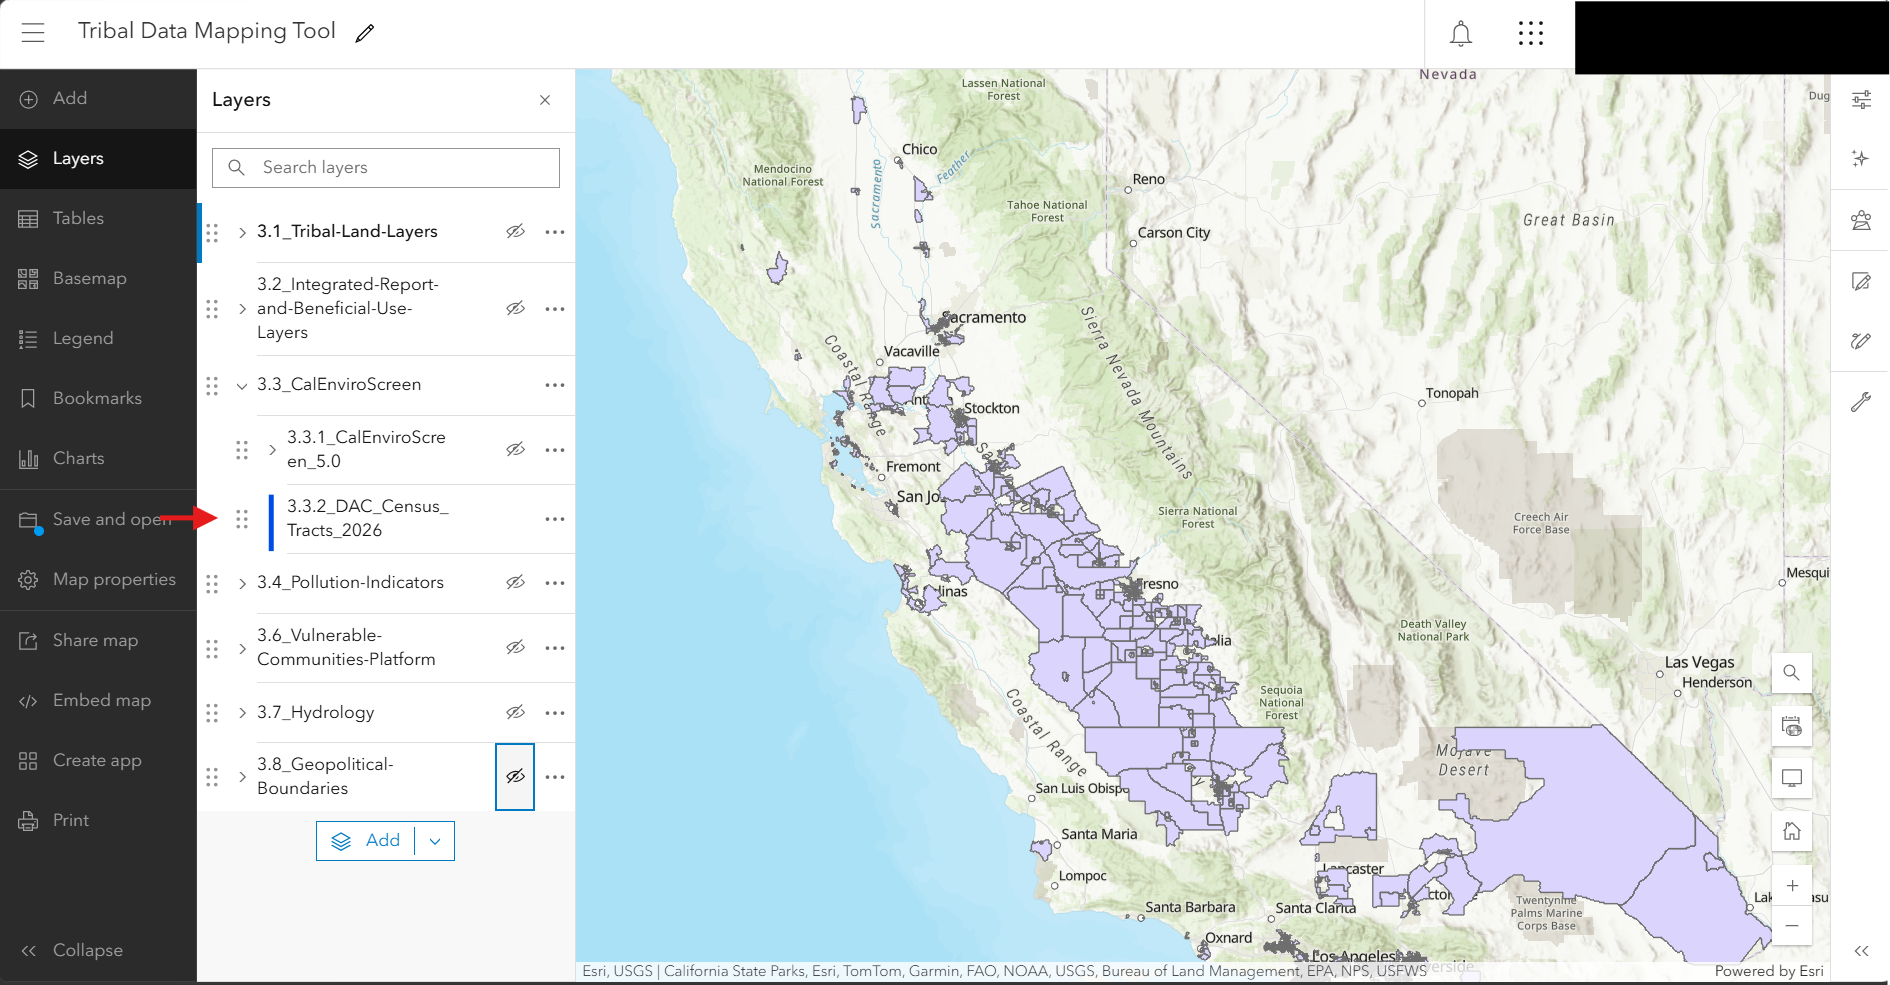
This map shows the disadvantaged communities designated by CalEPA for the purpose of SB 535, which requires that a minimum share of the proceeds from the state’s Cap-and-Invest Program benefit California’s most burdened communities. As of 2026, these areas represent the 25% highest overall scoring census tracts in CalEnviroScreen 5.0, as well as census tracts with the highest 5% of CalEnviroScreen 5.0 pollution tracts, census tracts that overlap geographically at least by 25% with a 2022 DAC-designated census tract based on CalEnviroScreen 4.0, and federally recognized tribal lands. This allows some of the previous DAC-designated census tracts to retain funding, despite changes to census boundaries, and prioritizes the most extreme instances of environmental pollution regardless of social vulnerability. An important note is that while tribal lands are included in the 2026 DAC communities, these geographic layers are not repeated in this section. Instead, we ask the user to add layers from section 3.1 (specifically 3.1.1.6 All Tracts) to visualize all DAC communities.

Screenshot of interactive map showing disadvantaged communities in CalEnviroScreen 5.0

Screenshot of interactive map showing disadvantaged communities in CalEnviroScreen 5.0

Source: California Environmental Protection Agency

Source update frequency: As needed

automatically synced here

Contact: DAC Inquiries

3.4 Pollution Indicators

3.4.1 Agricultural Pesticides

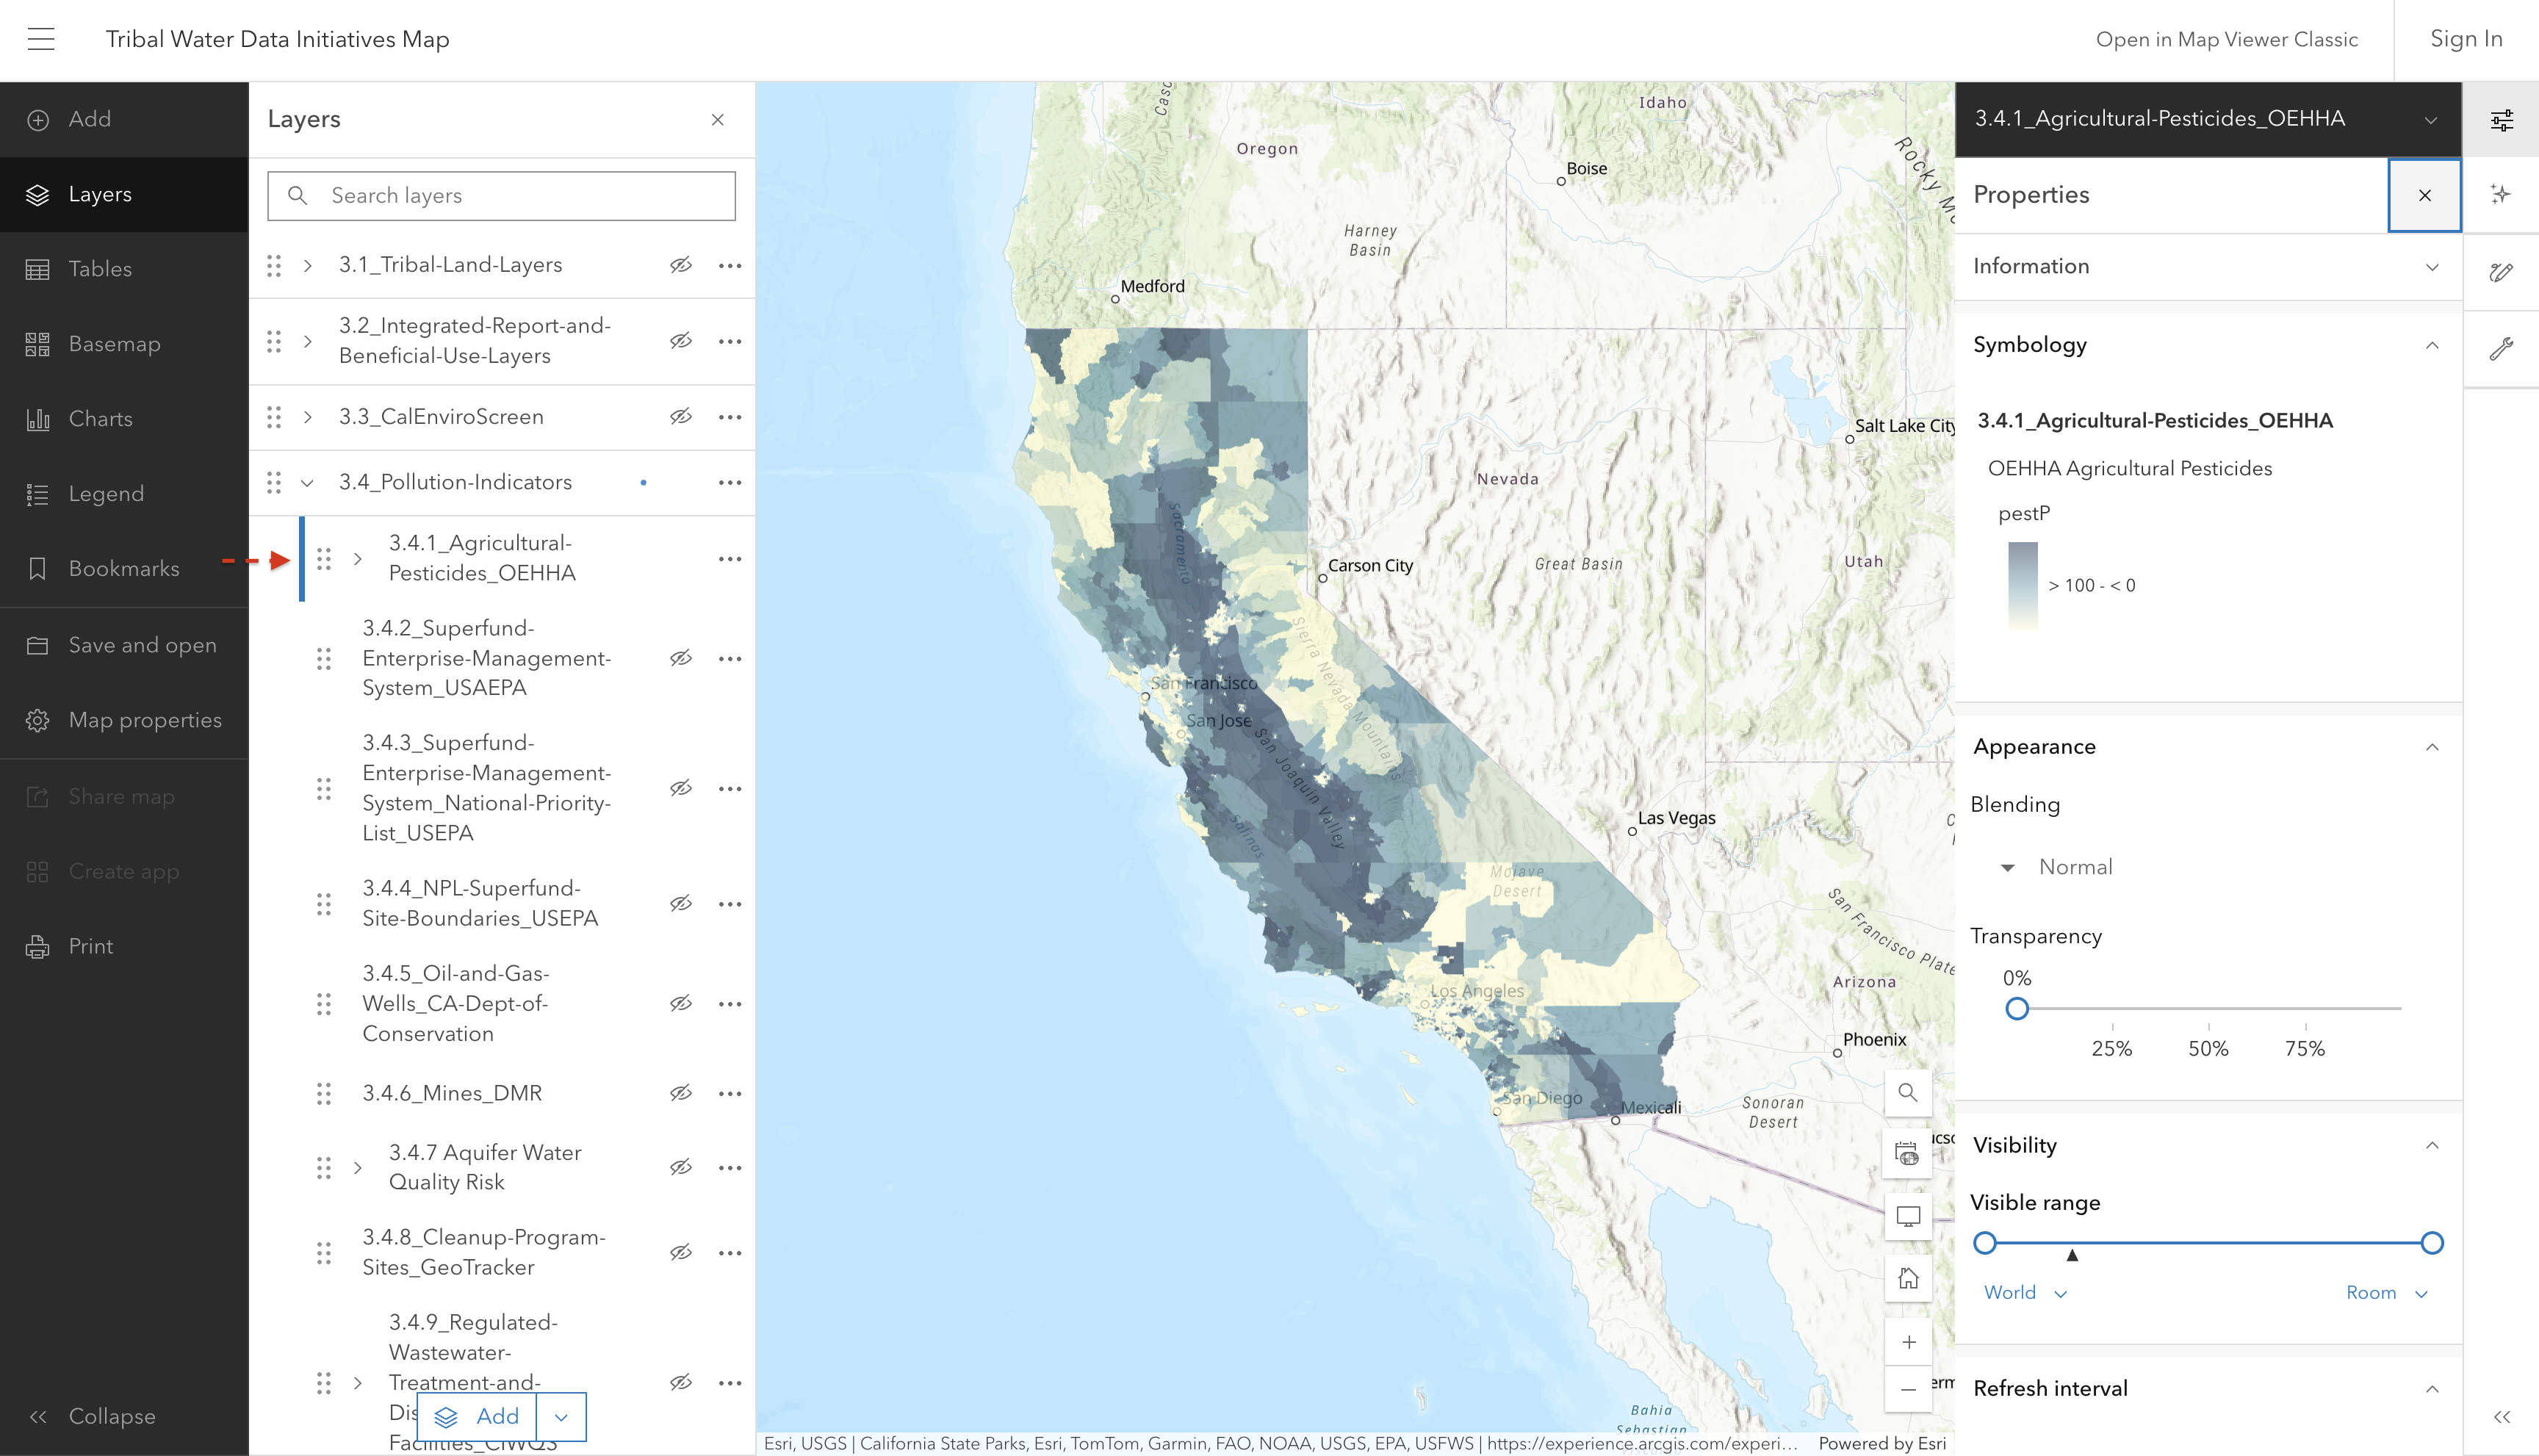
This indicator represents the reported use of 132 hazardous and volatile pesticides in 2017-2019. Only pesticides used on agricultural commodities are included in the indicator. The data is averaged over the census tract area, and some application may be adjacent to (instead of within) the census tract.

Screenshot of interactive map showing pesticide use intensity by census tract

Source: California Office of Environmental Health Hazard Assessment (OEHHA)

Source update frequency: As needed

automatically synced here

Contact: CalEnviroScreen

3.4.2 Superfund Enterprise Management System Sites

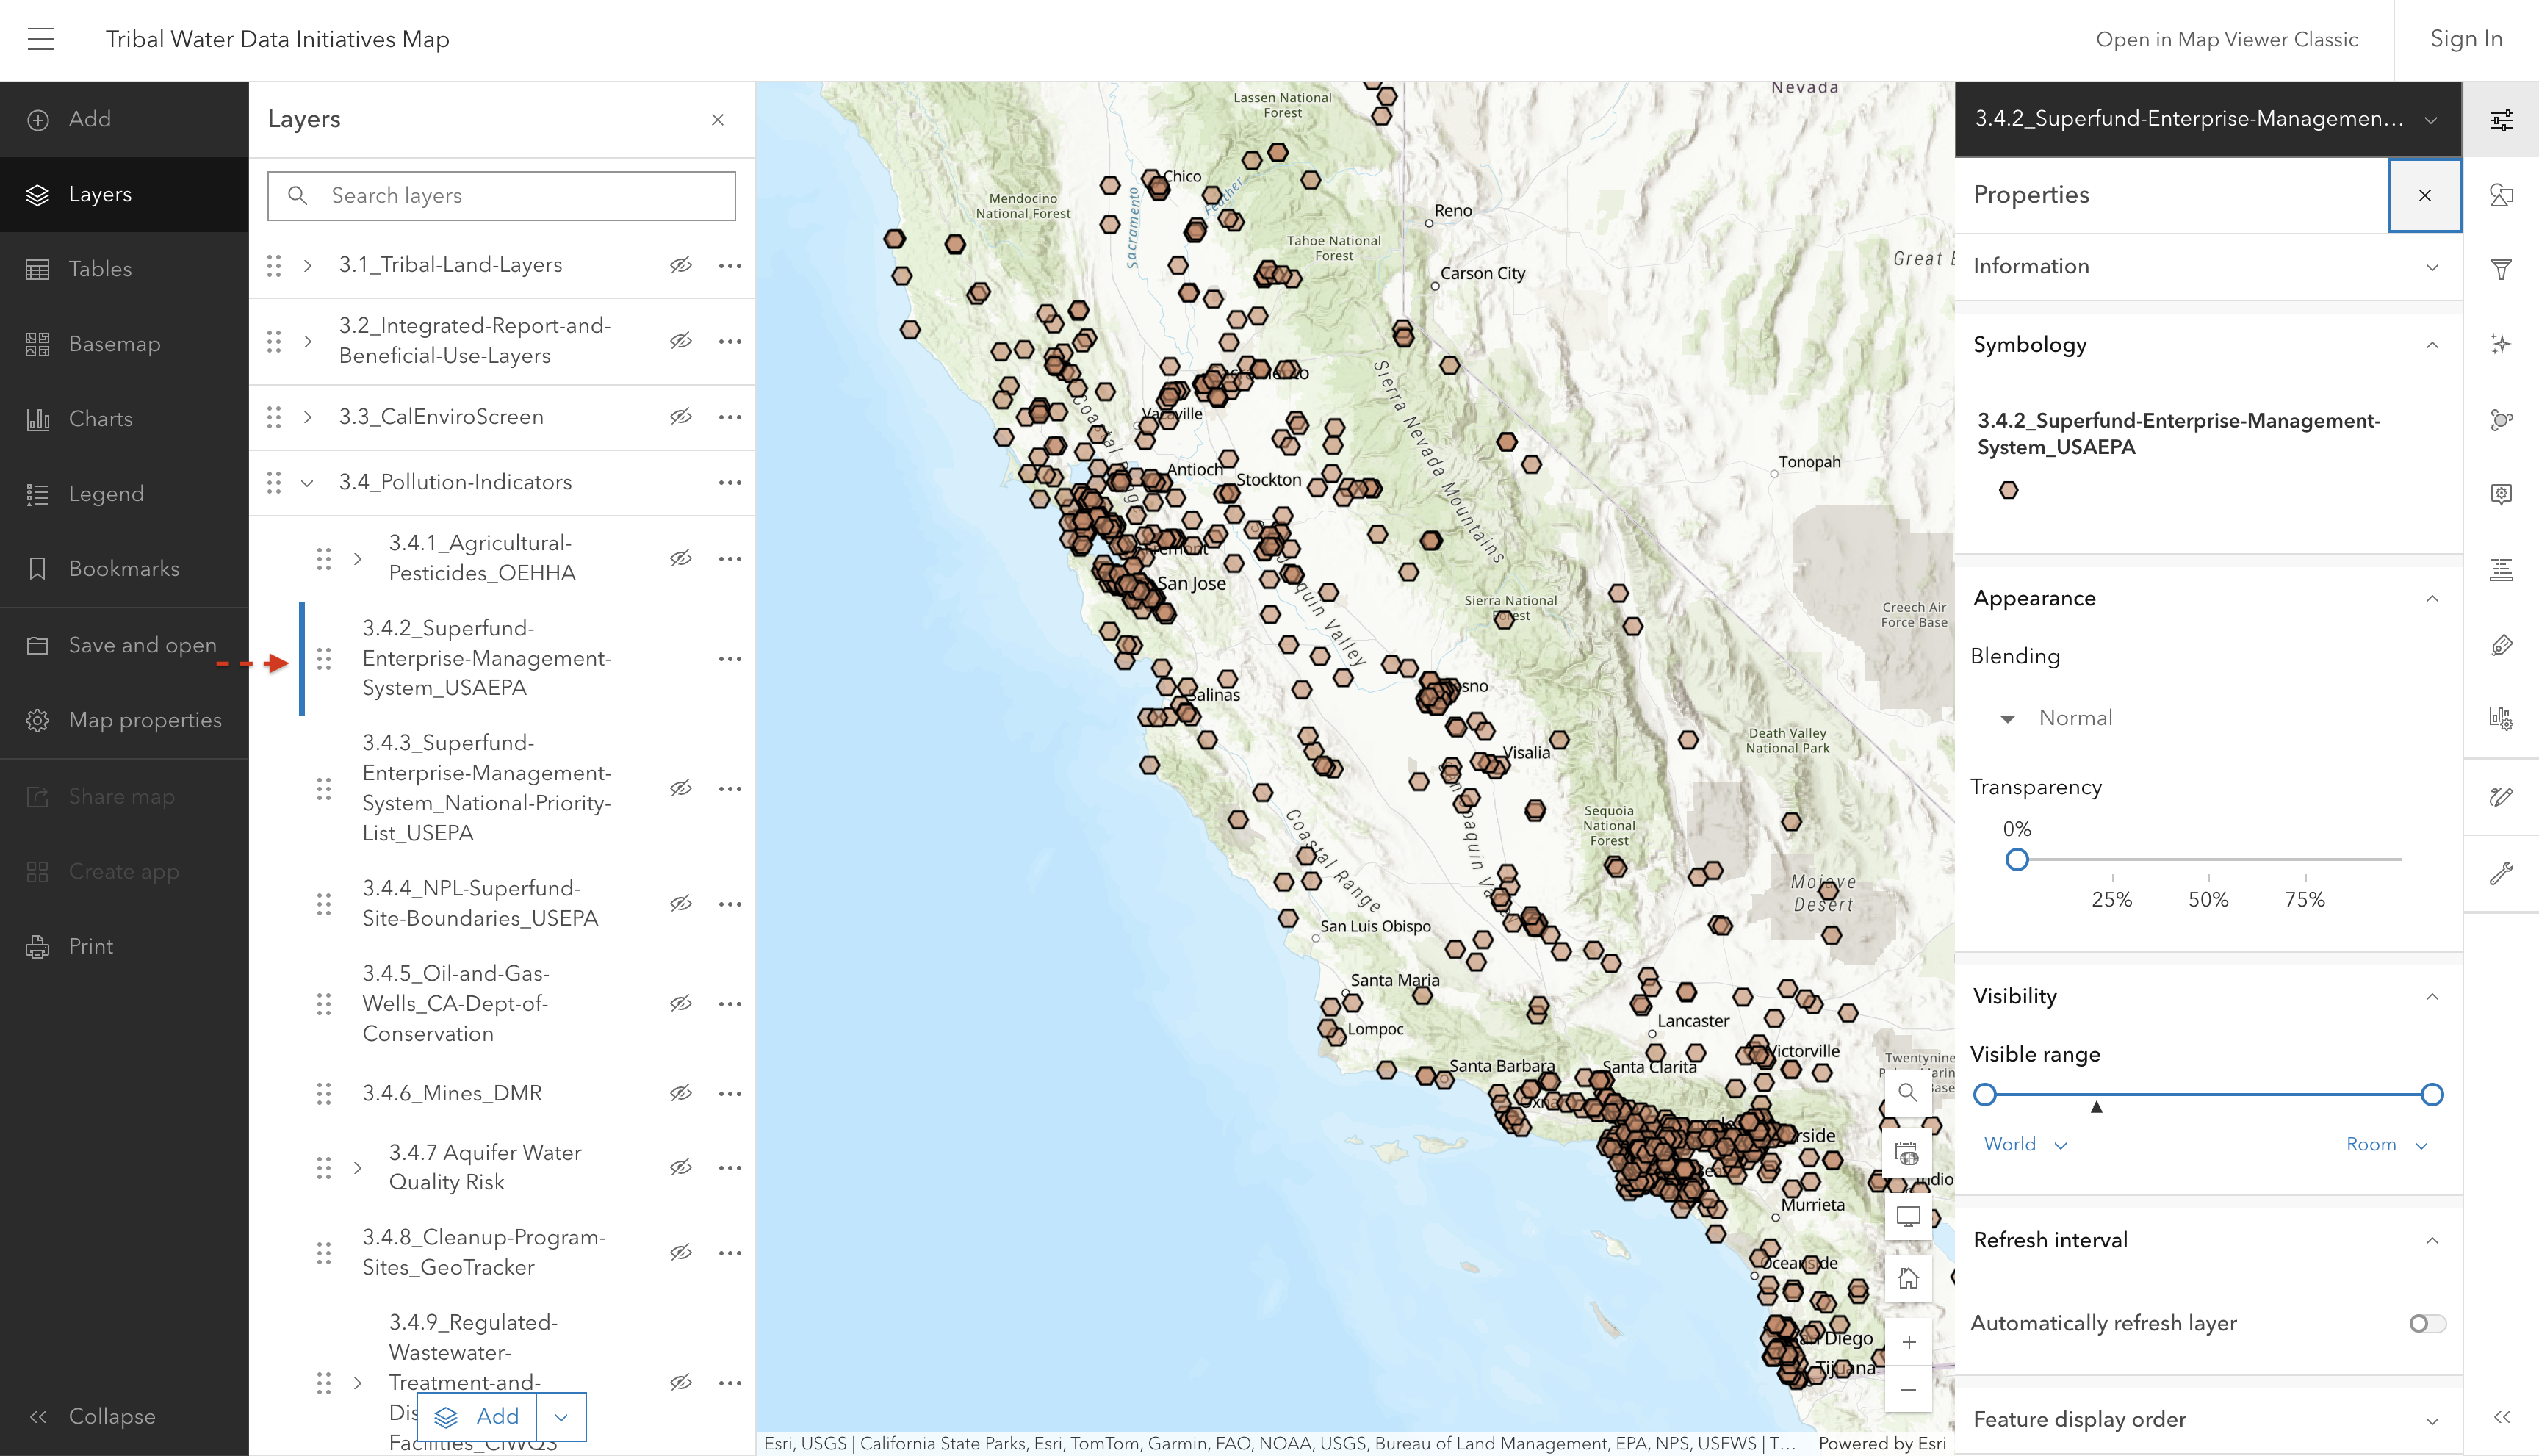
This layer shows location and attribute information on facilities regulated under the Superfund Enterprise Management System (SEMS). Data includes the inventory of active and archived hazardous waste sites evaluated by the EPA’s Superfund program.

Screenshot of interactive map showing EPA Superfund sites

Source: U.S. Environmental Protection Agency (EPA)

Source update frequency: As needed

manually updated here June 2025

Contact: U.S Environmental Protection Agency (EPA)

3.4.3 Superfund Enterprise Management System National Priority List (NPL) Sites

This layer shows sites that are listed on the Superfund NPL. The NPL lists national priorities among the known releases or threatened releases of hazardous substances, pollutants, or contaminants throughout the United States.

screenshot coming soon

Source: U.S. Environmental Protection Agency (EPA)

Source update frequency: As needed

manually updated here June 2025

Contact: U.S Environmental Protection Agency (EPA)

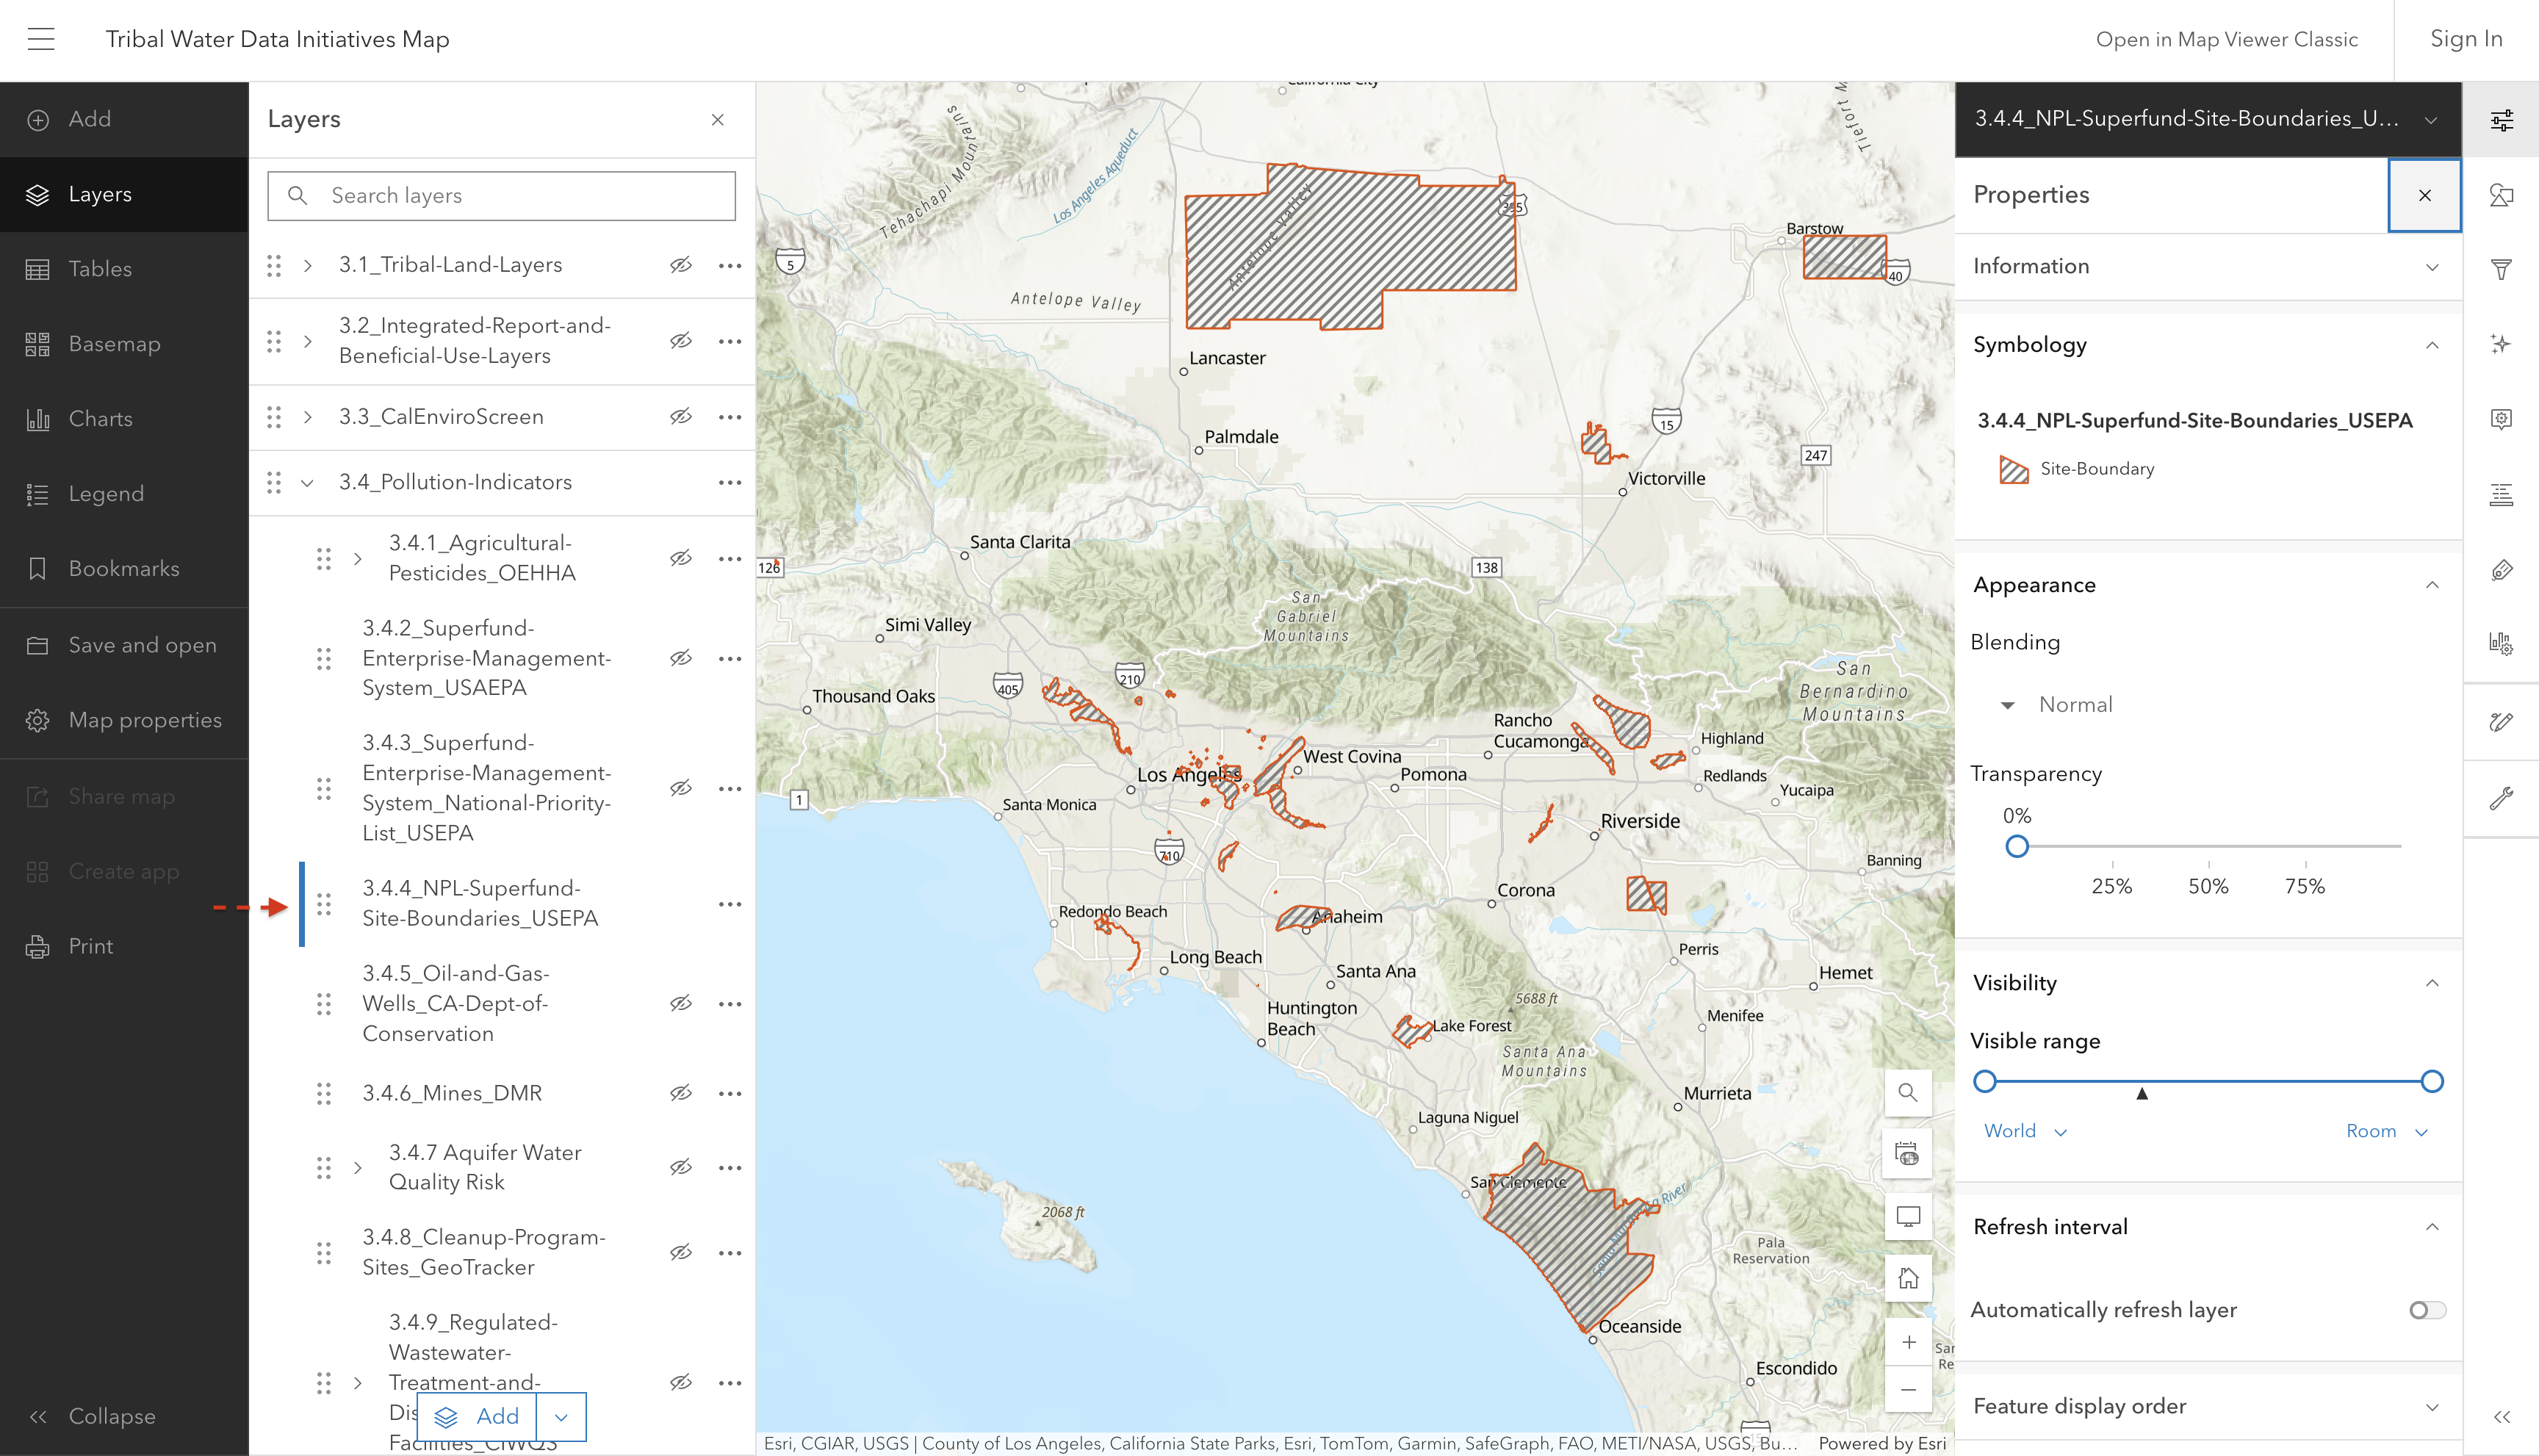
3.4.4 NPL Superfund Site Boundaries

This layer shows entire Superfund site boundaries.

Screenshot of interactive map showing NPL Superfund Site boundaries

U.S. EPA Superfund Site boundaries are polygons representing the footprint of a whole site, defined for purposes of this effort as the sum of all of the Operable Units and the current understanding of the full extent of contamination.

Source: U.S. Environmental Protection Agency (EPA)

Source update frequency: Monthly

manually updated here June 2025

Contact: U.S Environmental Protection Agency (EPA)

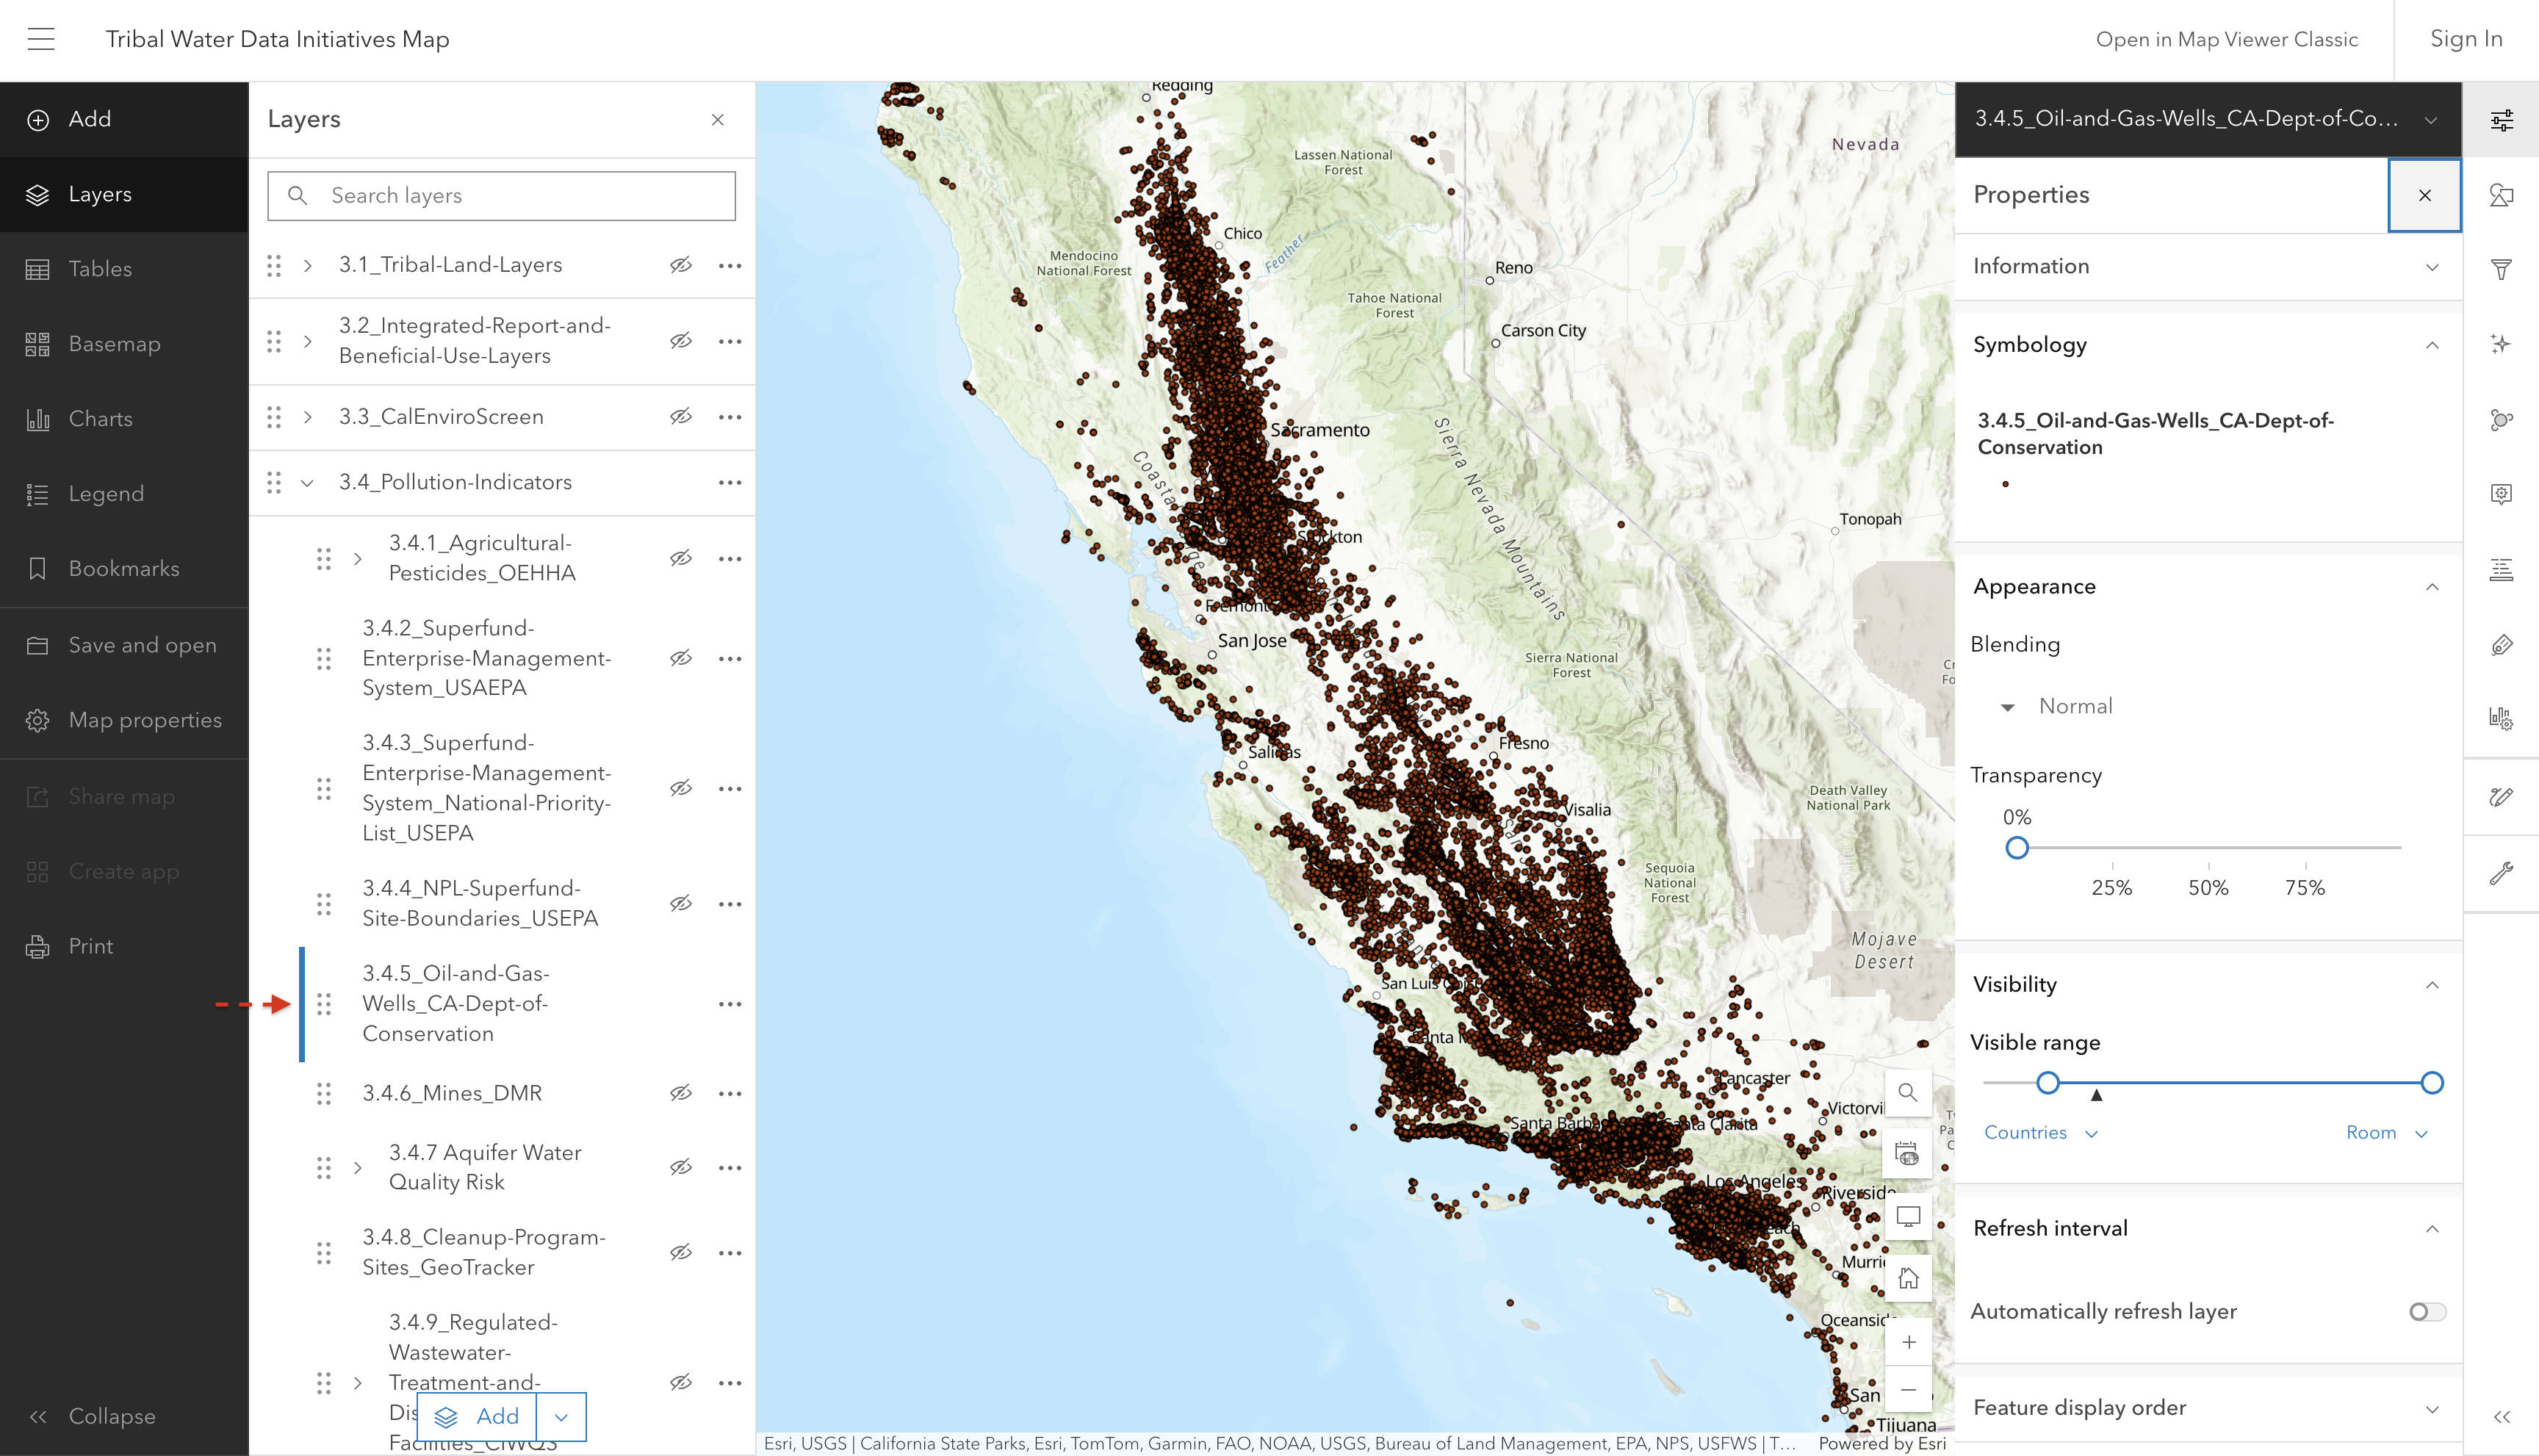
3.4.5 Oil and Gas Wells

This layer shows oil and gas well locations (and their associated records) across California.

Screenshot of interactive map showing oil and gas well locations

Source: WellFinder, published by the California Department of Conservation and Geologic Energy Management Division

Source update frequency: As needed

automatically synced here

Contact: WellFinder

3.4.6 Mines

This layer shows all mines in California labeled by mine status (color) and type (shape).

This data includes location, status, and other information regarding mine operations regulated under the Surface Mining and Reclamation Act of 1975 (SMARA) in California. The data presented is reported my mine operators in annual reports provided to CA Division of Mine Reclamation under Public Resources Code section 2207.

Additional information about commodities and resources/minerals from mines in California can be found here.

3.4.6.1 Mine Status

screenshot coming soon

Source: California Department of Conservation Division of Mine Reclamation, Mines Online

Source update frequency: As needed

automatically synced here

Contact: California Department of Conservation - Division of Mine Reclamation

3.4.6.2 Mine Type

screenshot coming soon

Source: California Department of Conservation Division of Mine Reclamation, Mines Online

Source update frequency: As needed

automatically synced here

Contact: California Department of Conservation - Division of Mine Reclamation

3.4.6.3 Primary Mine Products

screenshot coming soon

Source: California Department of Conservation Division of Mine Reclamation, Mines Online

Source update frequency: As needed

automatically synced here

Contact: California Department of Conservation - Division of Mine Reclamation

3.4.7 Aquifer Water Quality Risk

Source: California State Water Resources Control Board

Source update frequency: Every year

automatically synced here

Contact: California State Water Resources Control Board

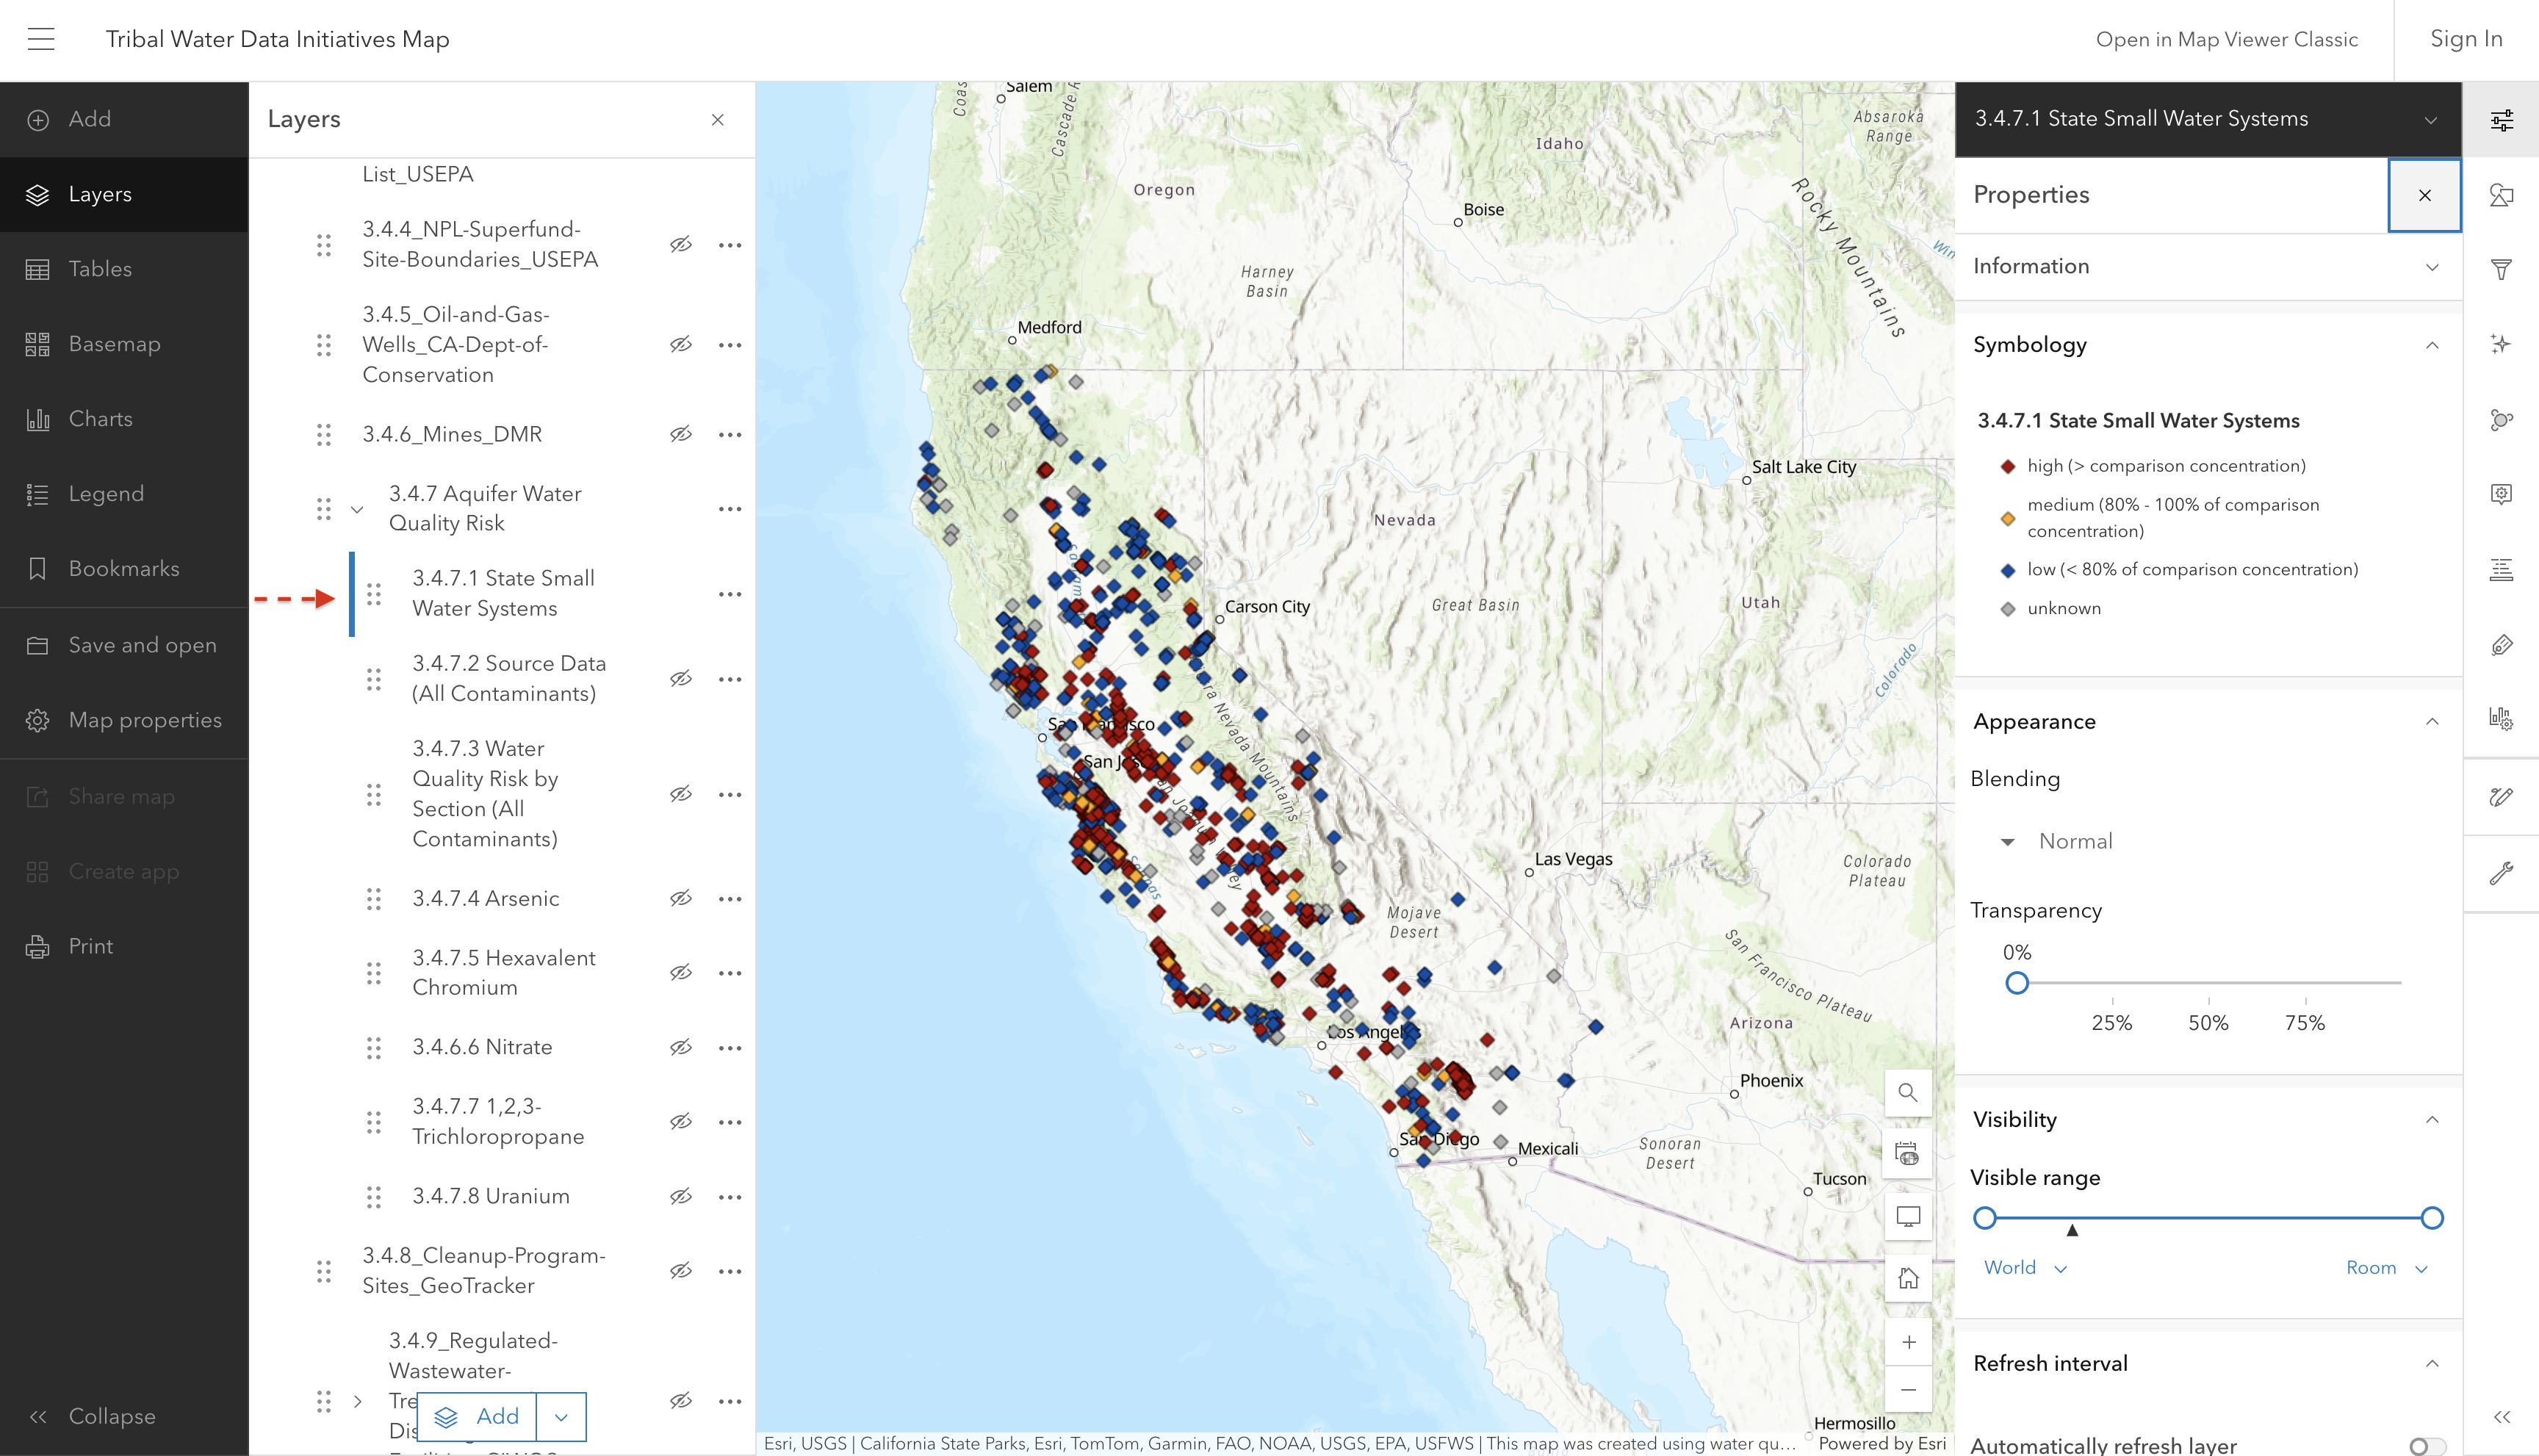
3.4.7.1 State Small Water Systems

Screenshot of interactive map showing state small water systems

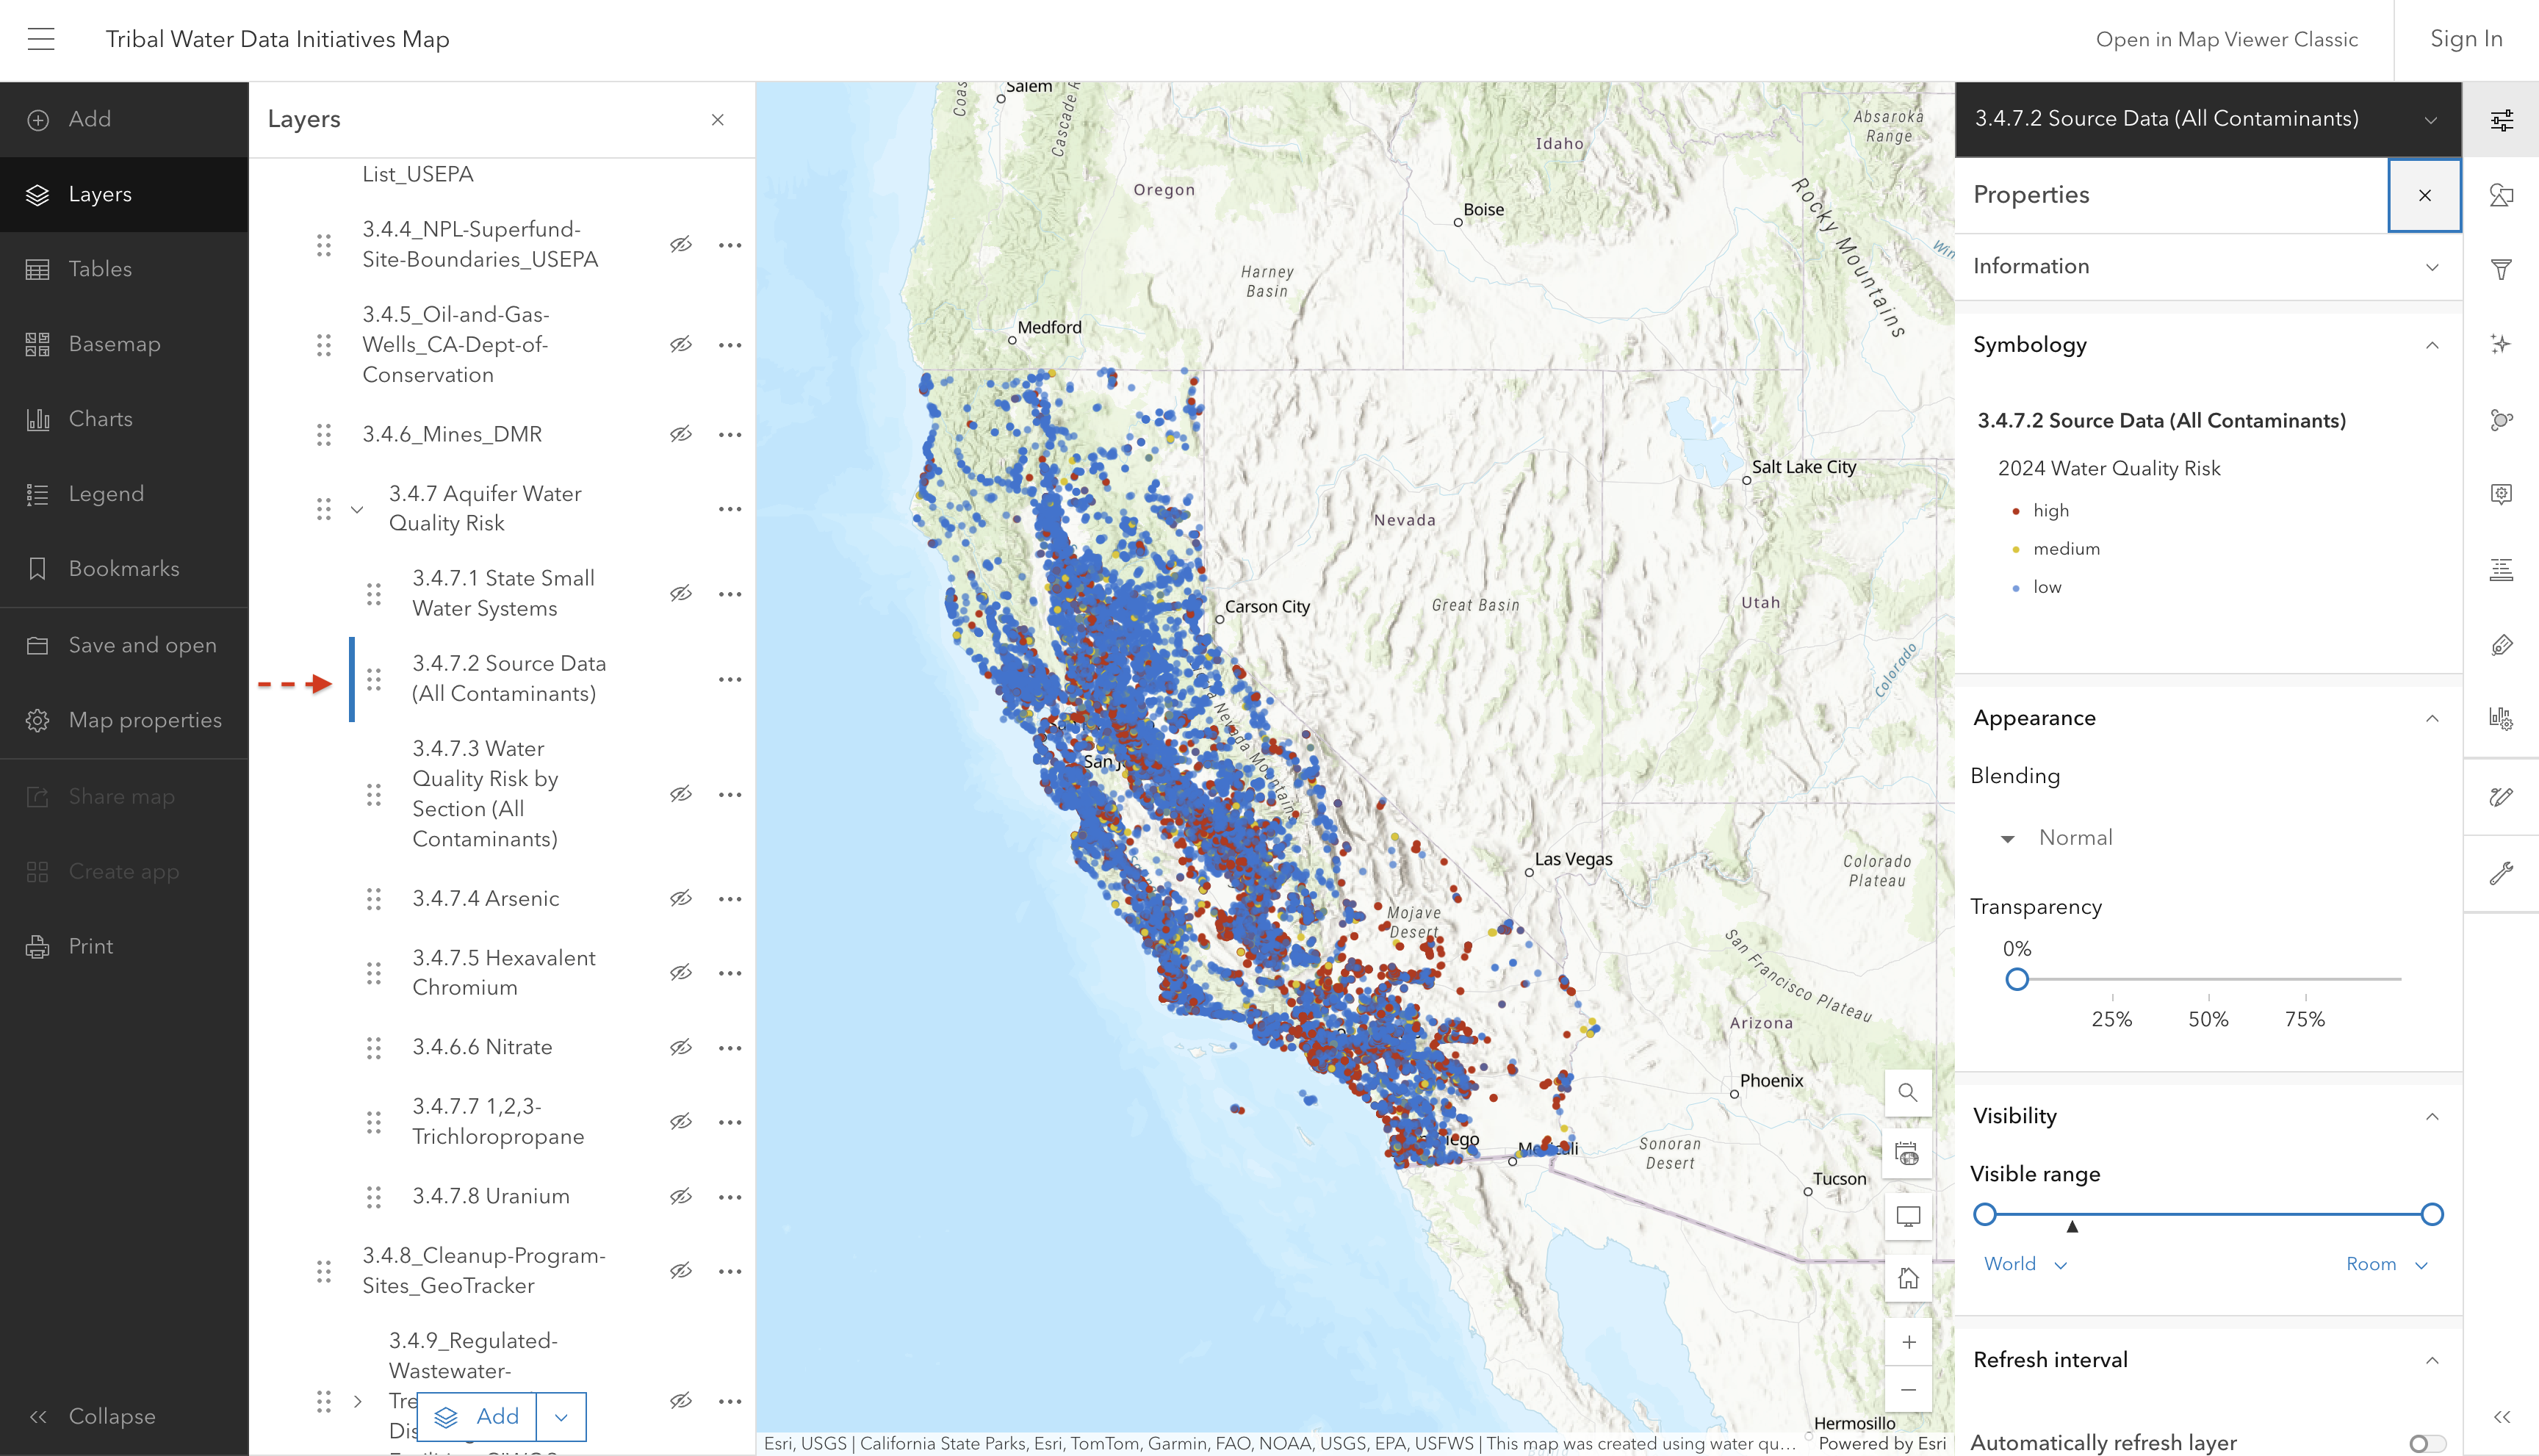
3.4.7.2 Source Data (All Contaminants)

Screenshot of interactive map showing source contaminant data

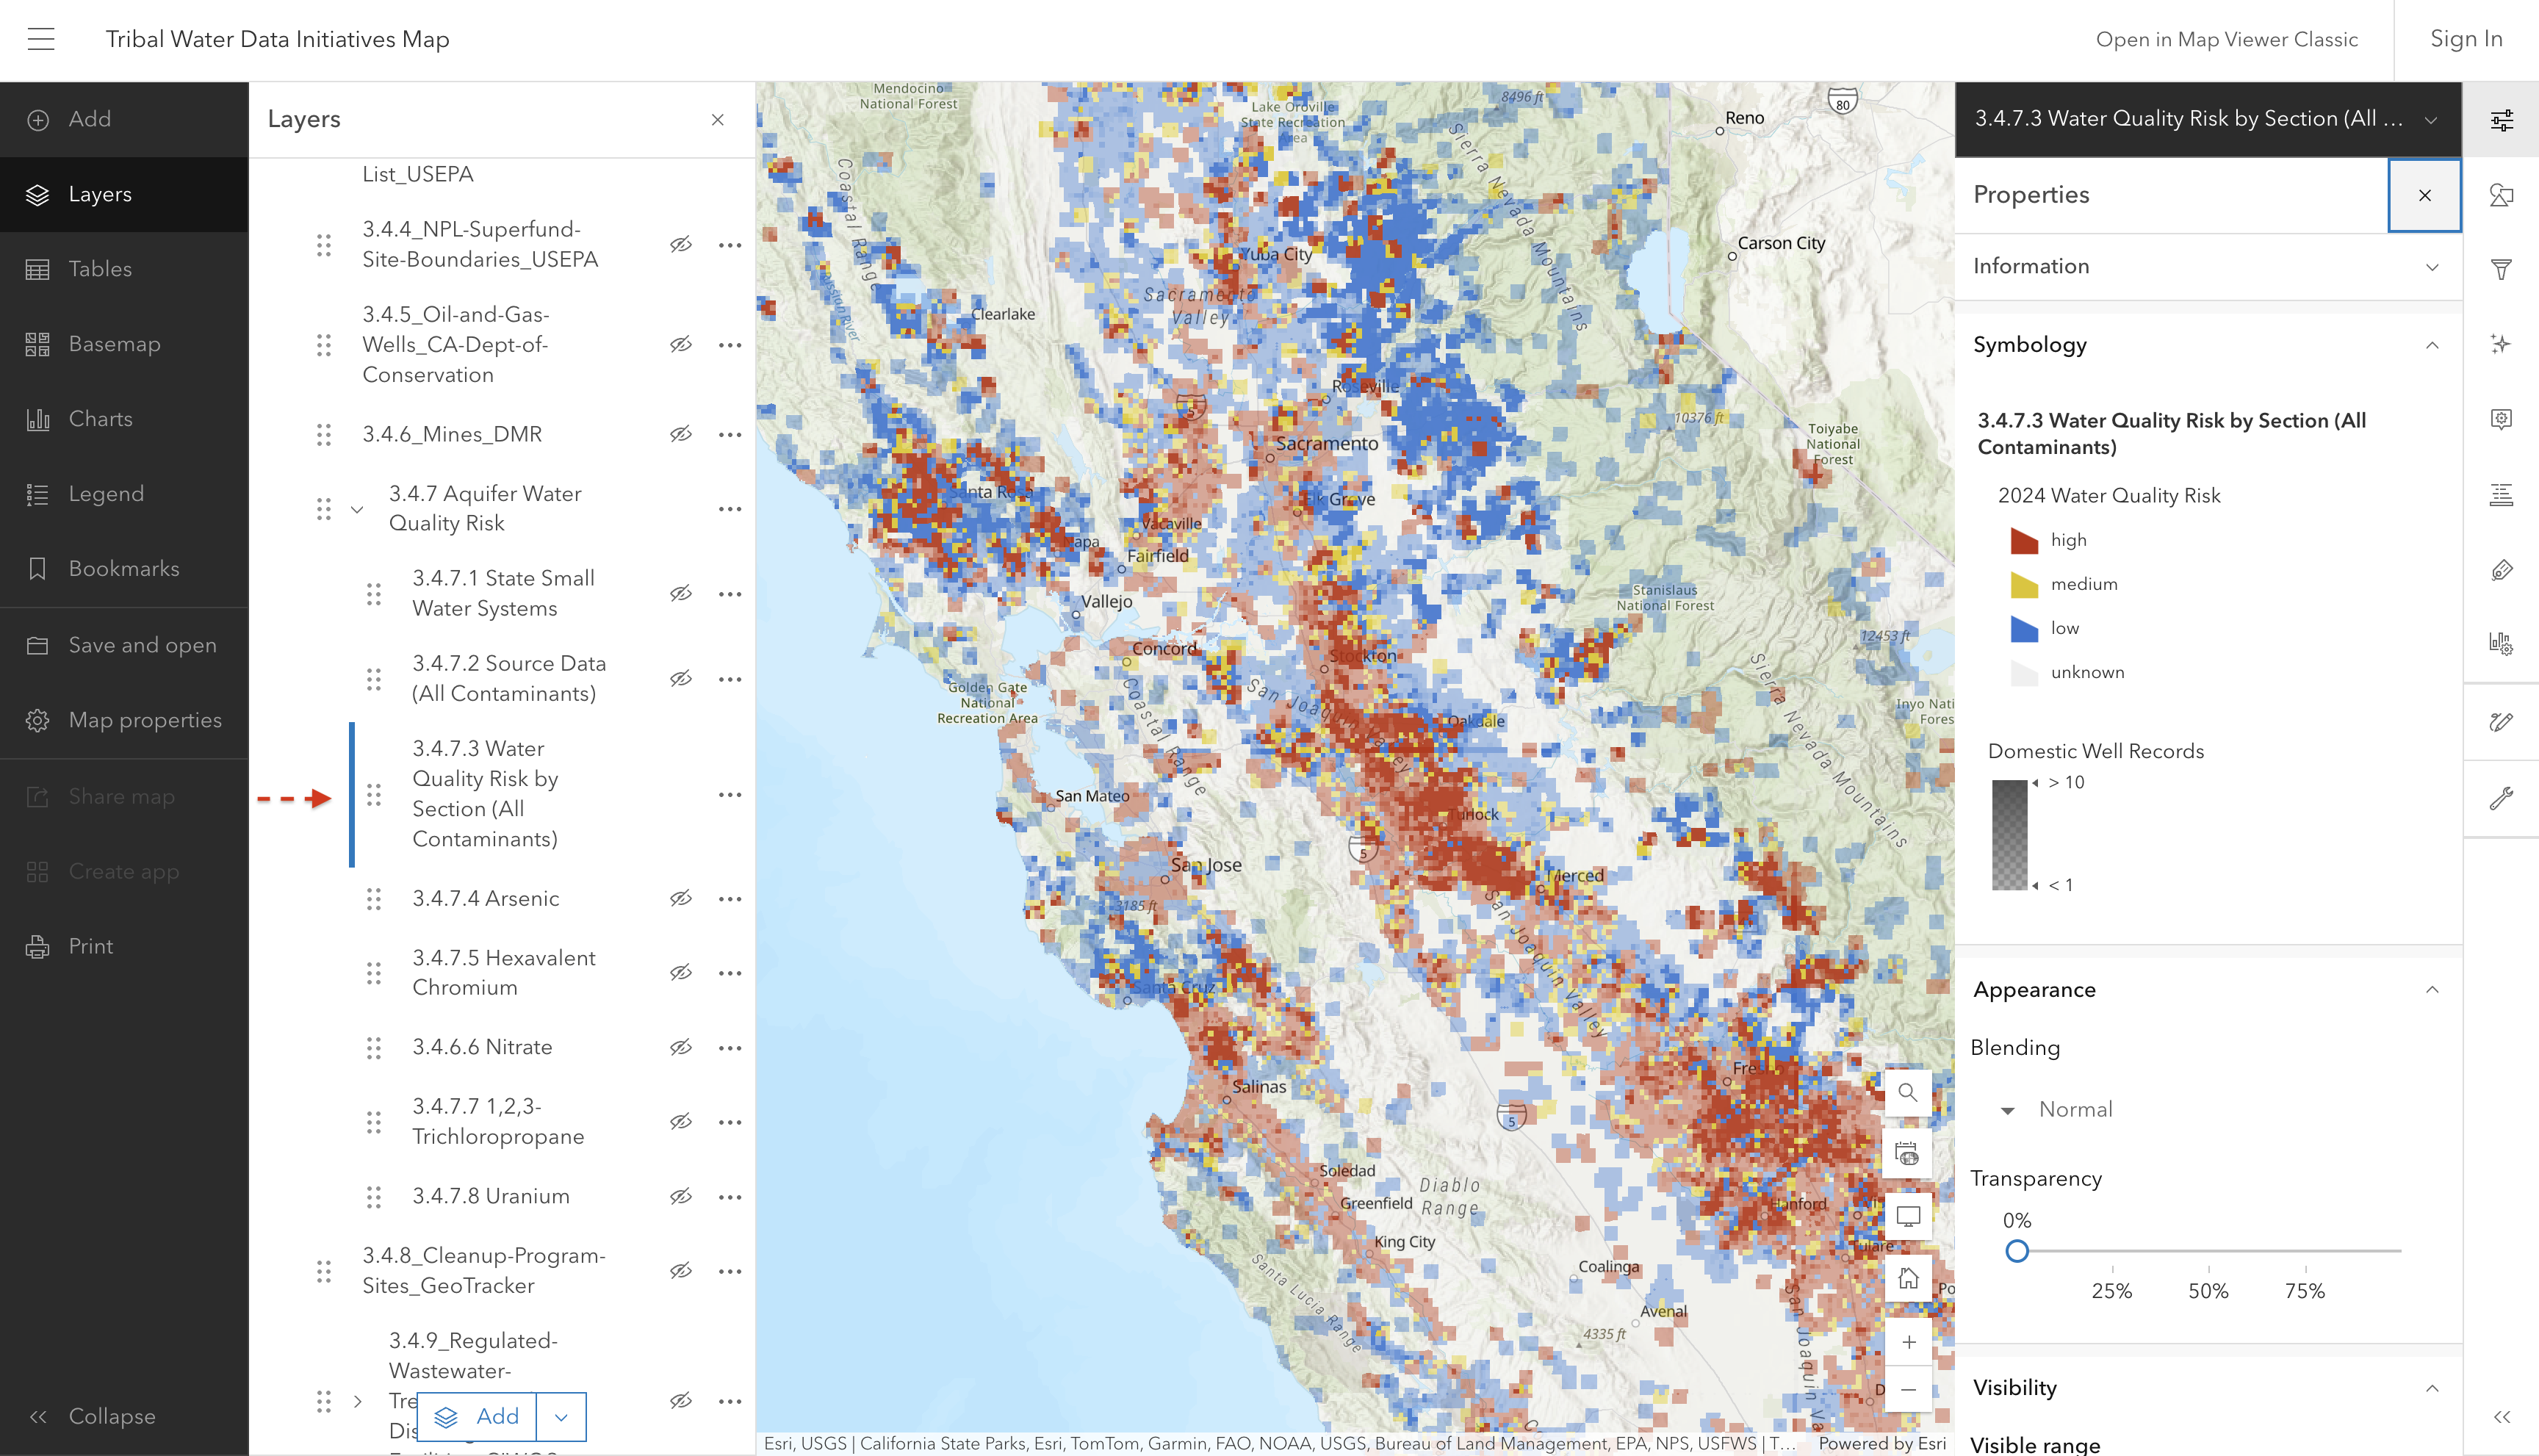
3.4.7.3 Water Quality Risk by Section (All Contaminants)

This layer shows estimated water quality risk for domestic wells and state small water systems for a variety of contaminants.

This layer was developed for use by the State Water Boards SAFER Program to help prioritize areas where domestic wells and state small water systems may be accessing groundwater that does not meet primary drinking water standards.

Screenshot of interactive map showing estimated water quality risk

Source: Groundwater Ambient Monitoring and Assessment (GAMA) Program

Source update frequency: As needed

automatically synced here

Contact: SAFER Program

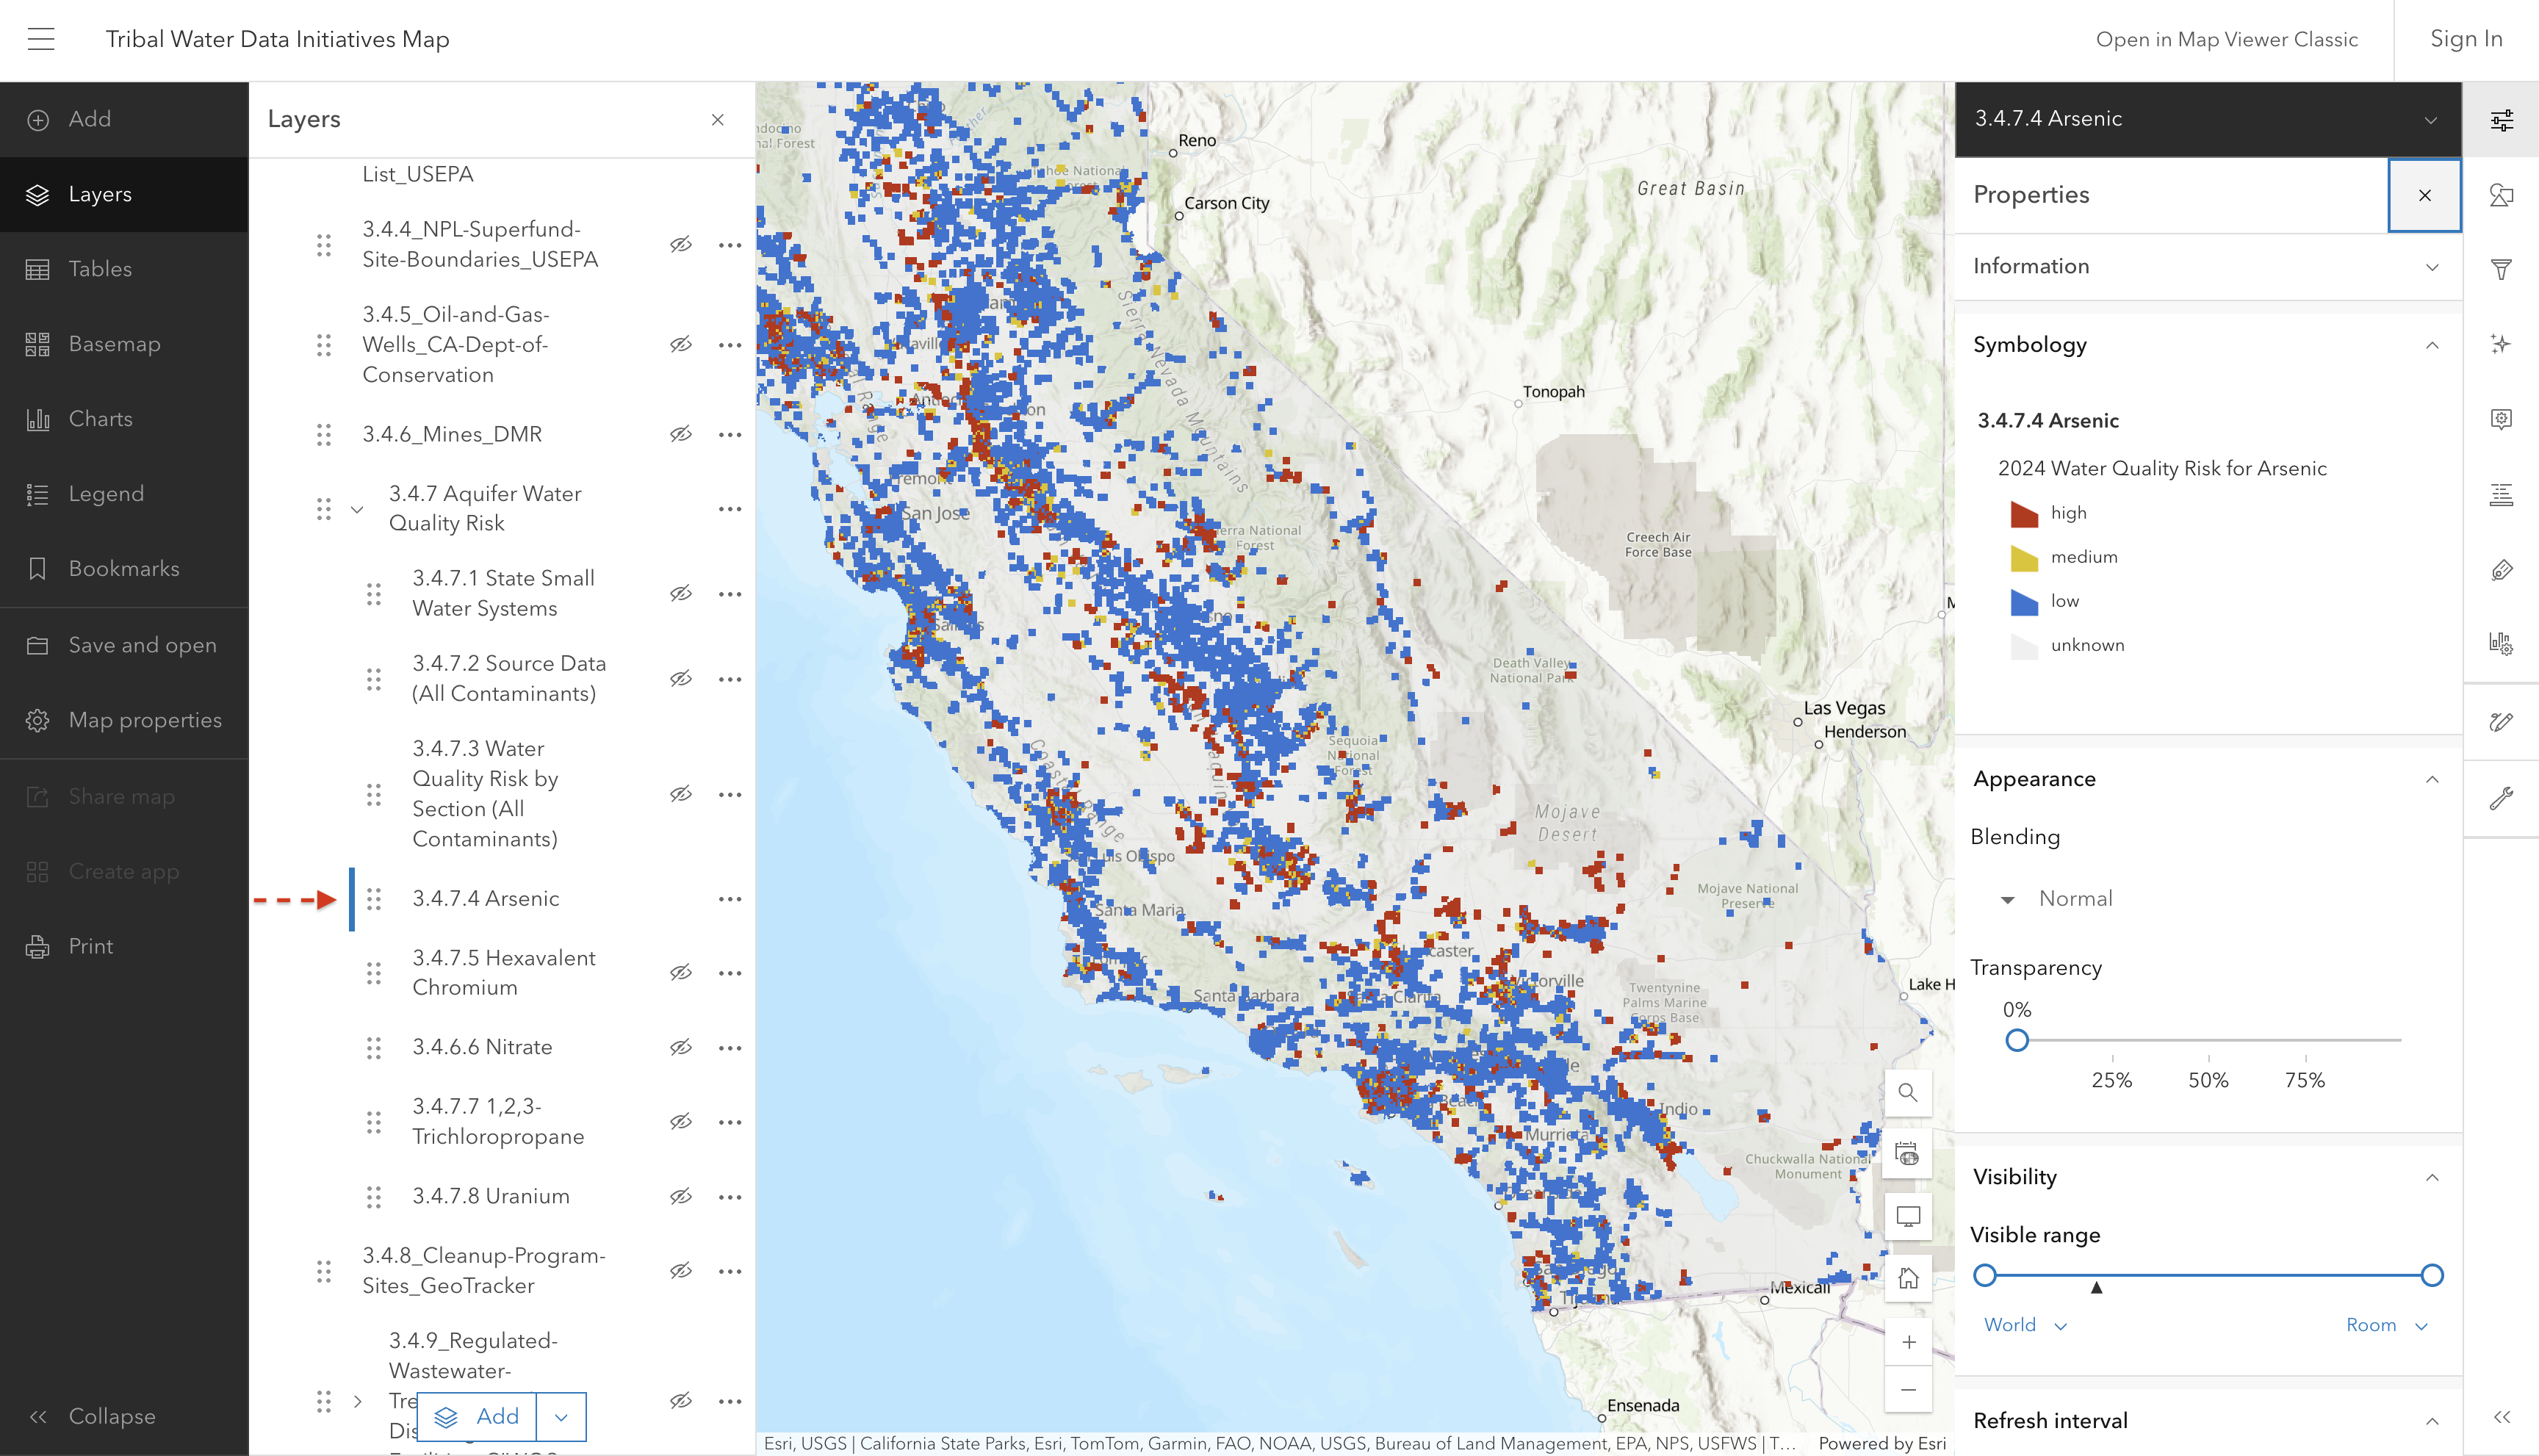
3.4.7.4 Arsenic

Screenshot of interactive map showing arsenic risk

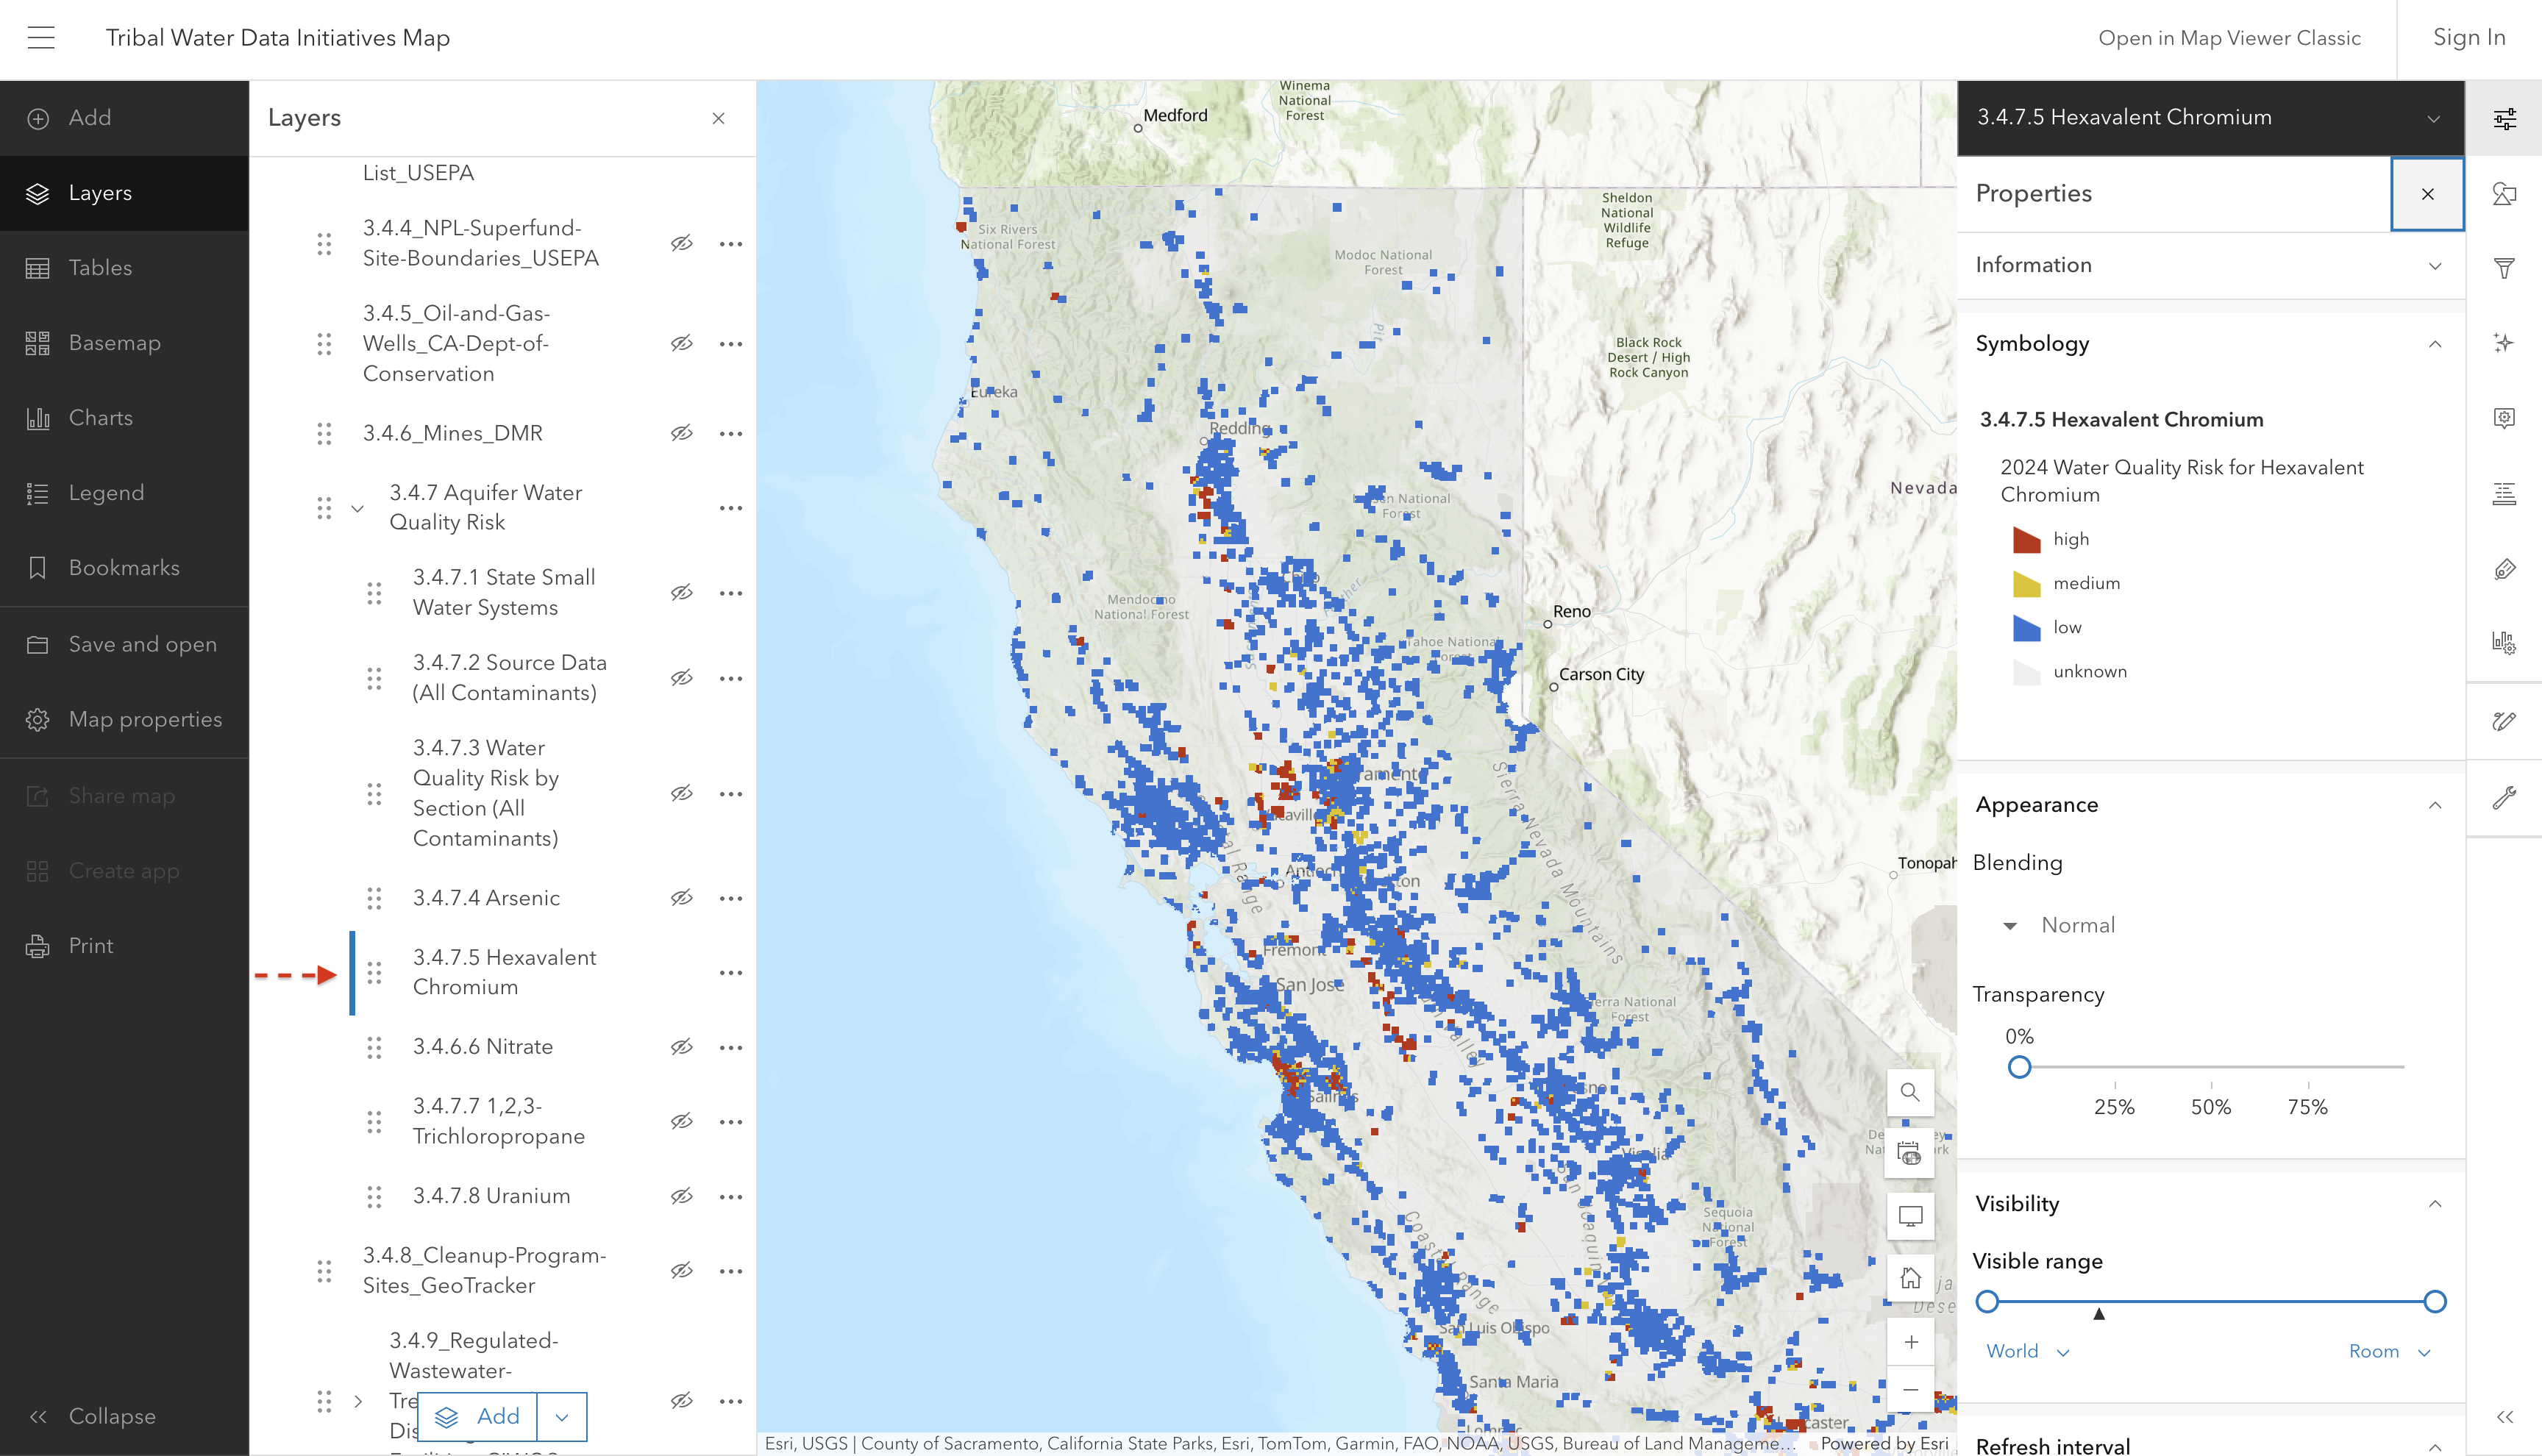
3.4.7.5 Hexavalent Chromium

Screenshot of interactive map showing hexavalent chromium risk

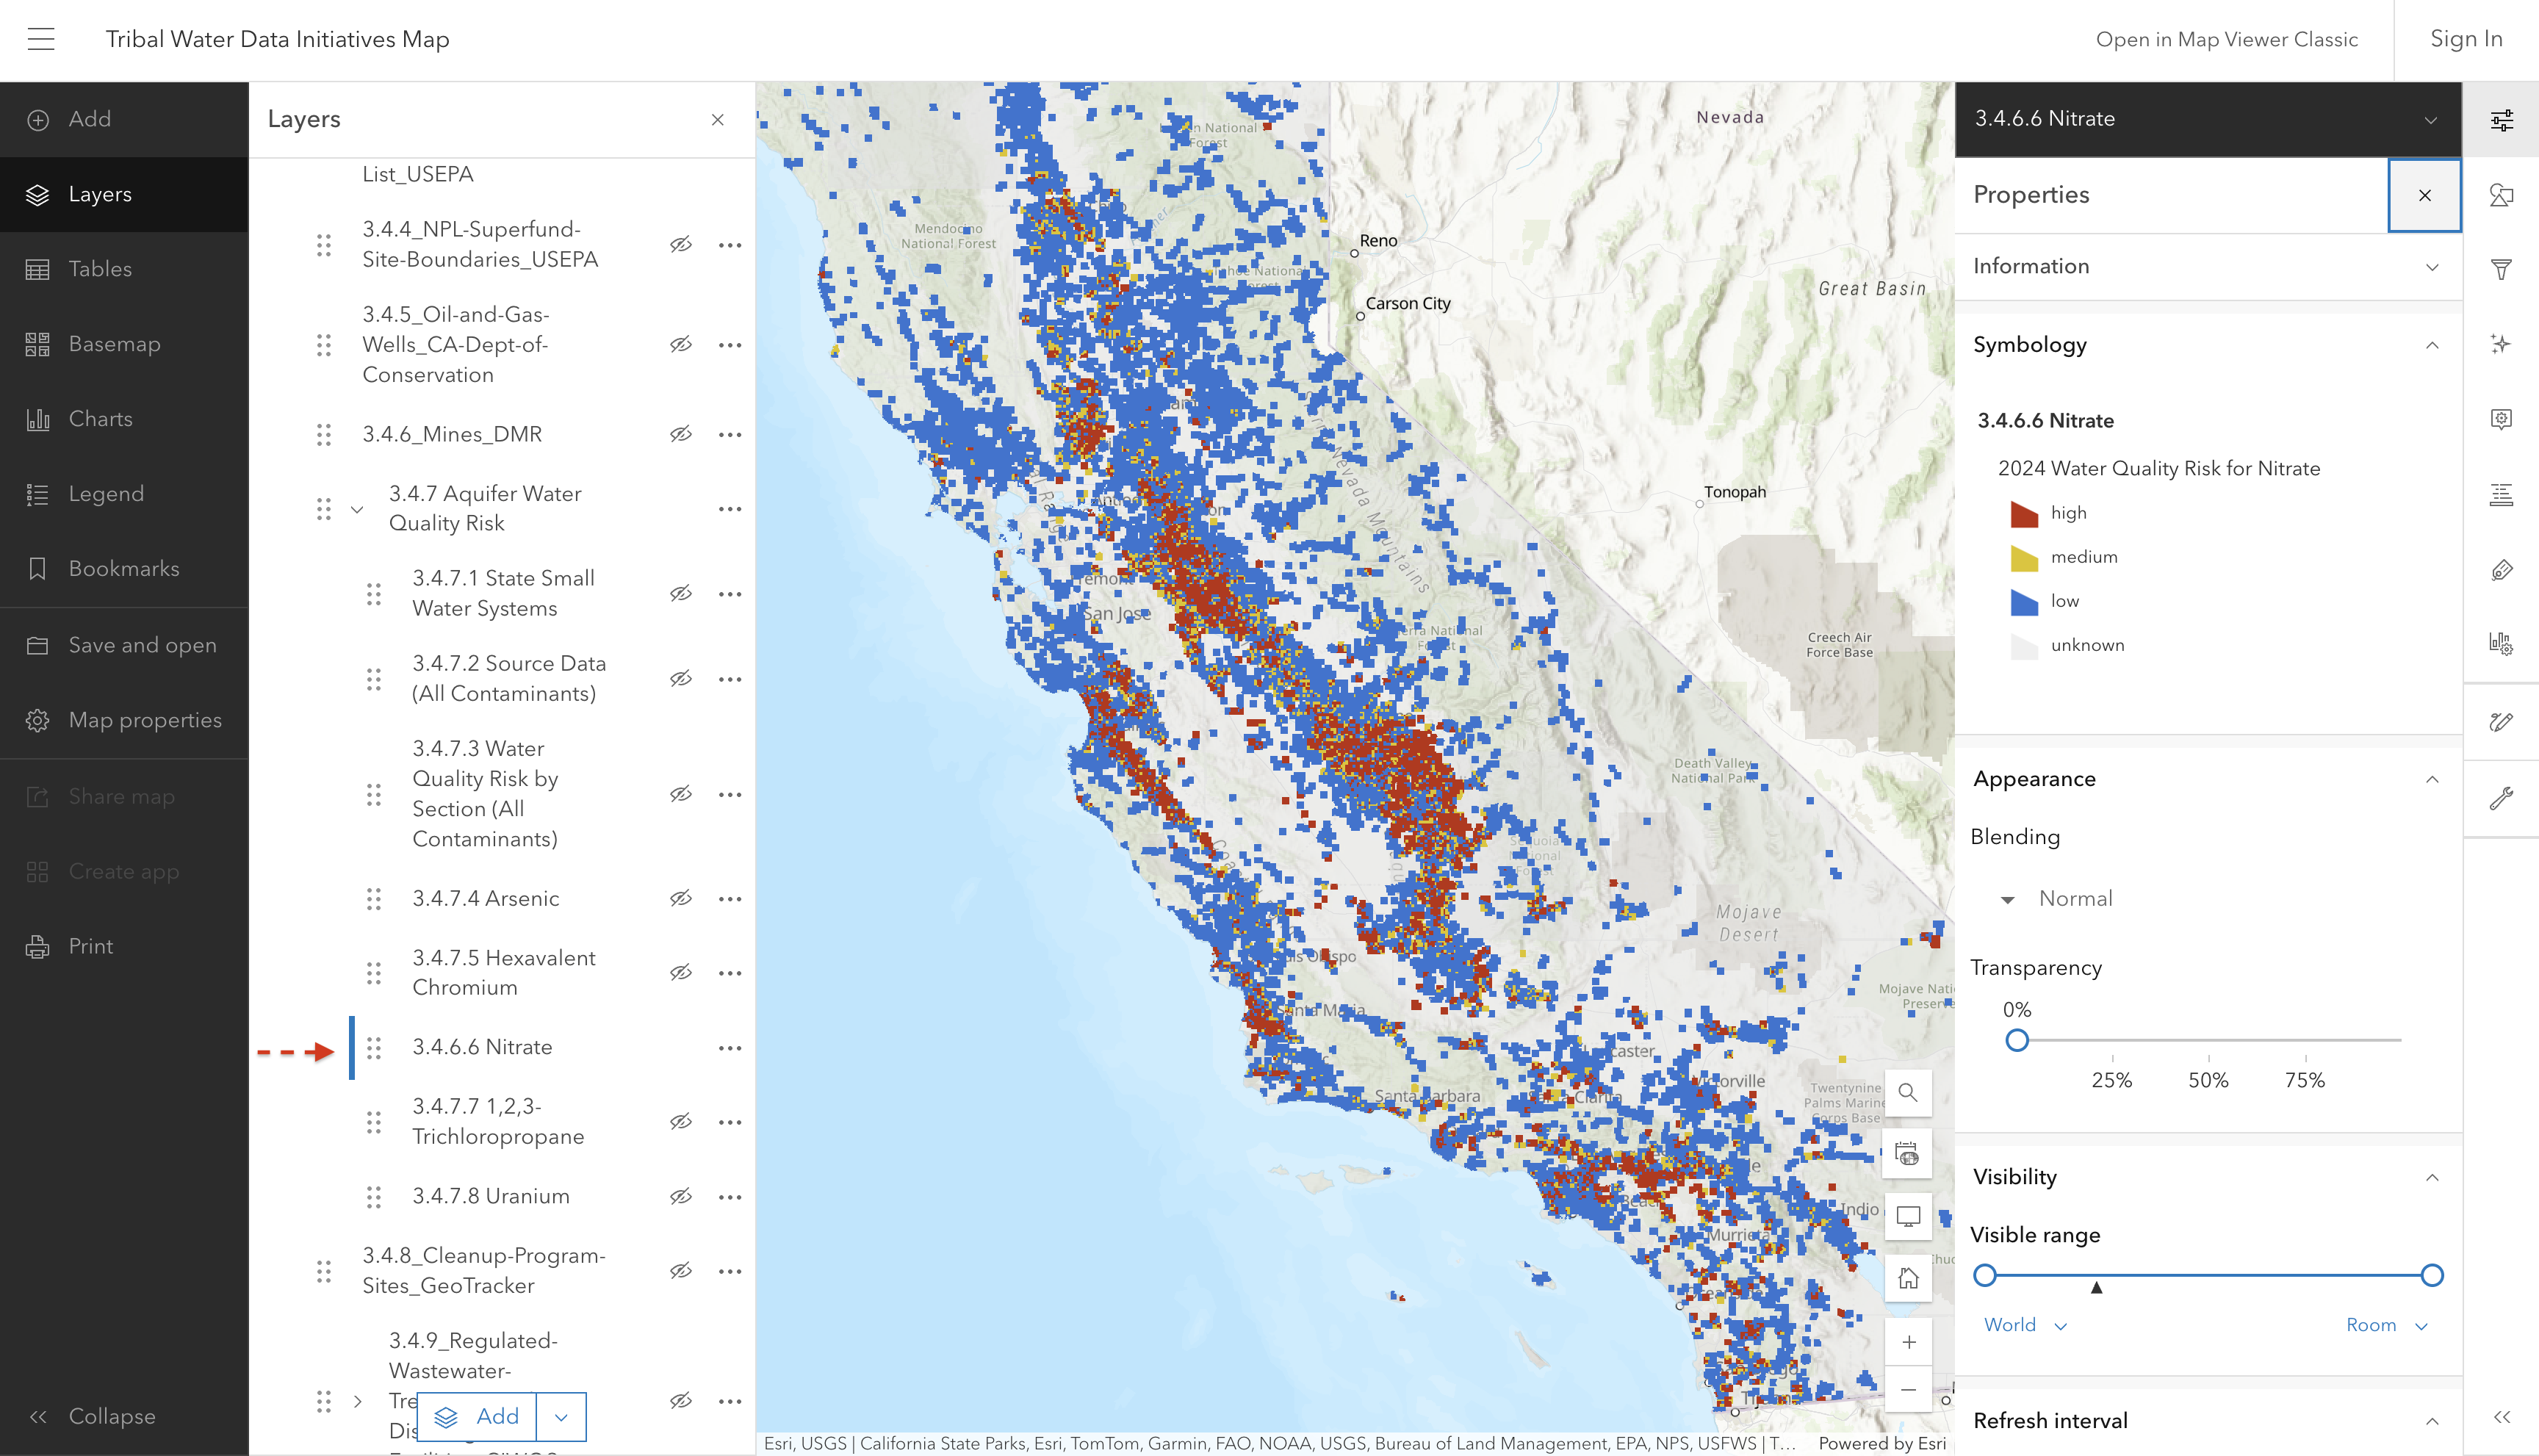
3.4.7.6 Nitrate

Screenshot of interactive map showing nitrate risk

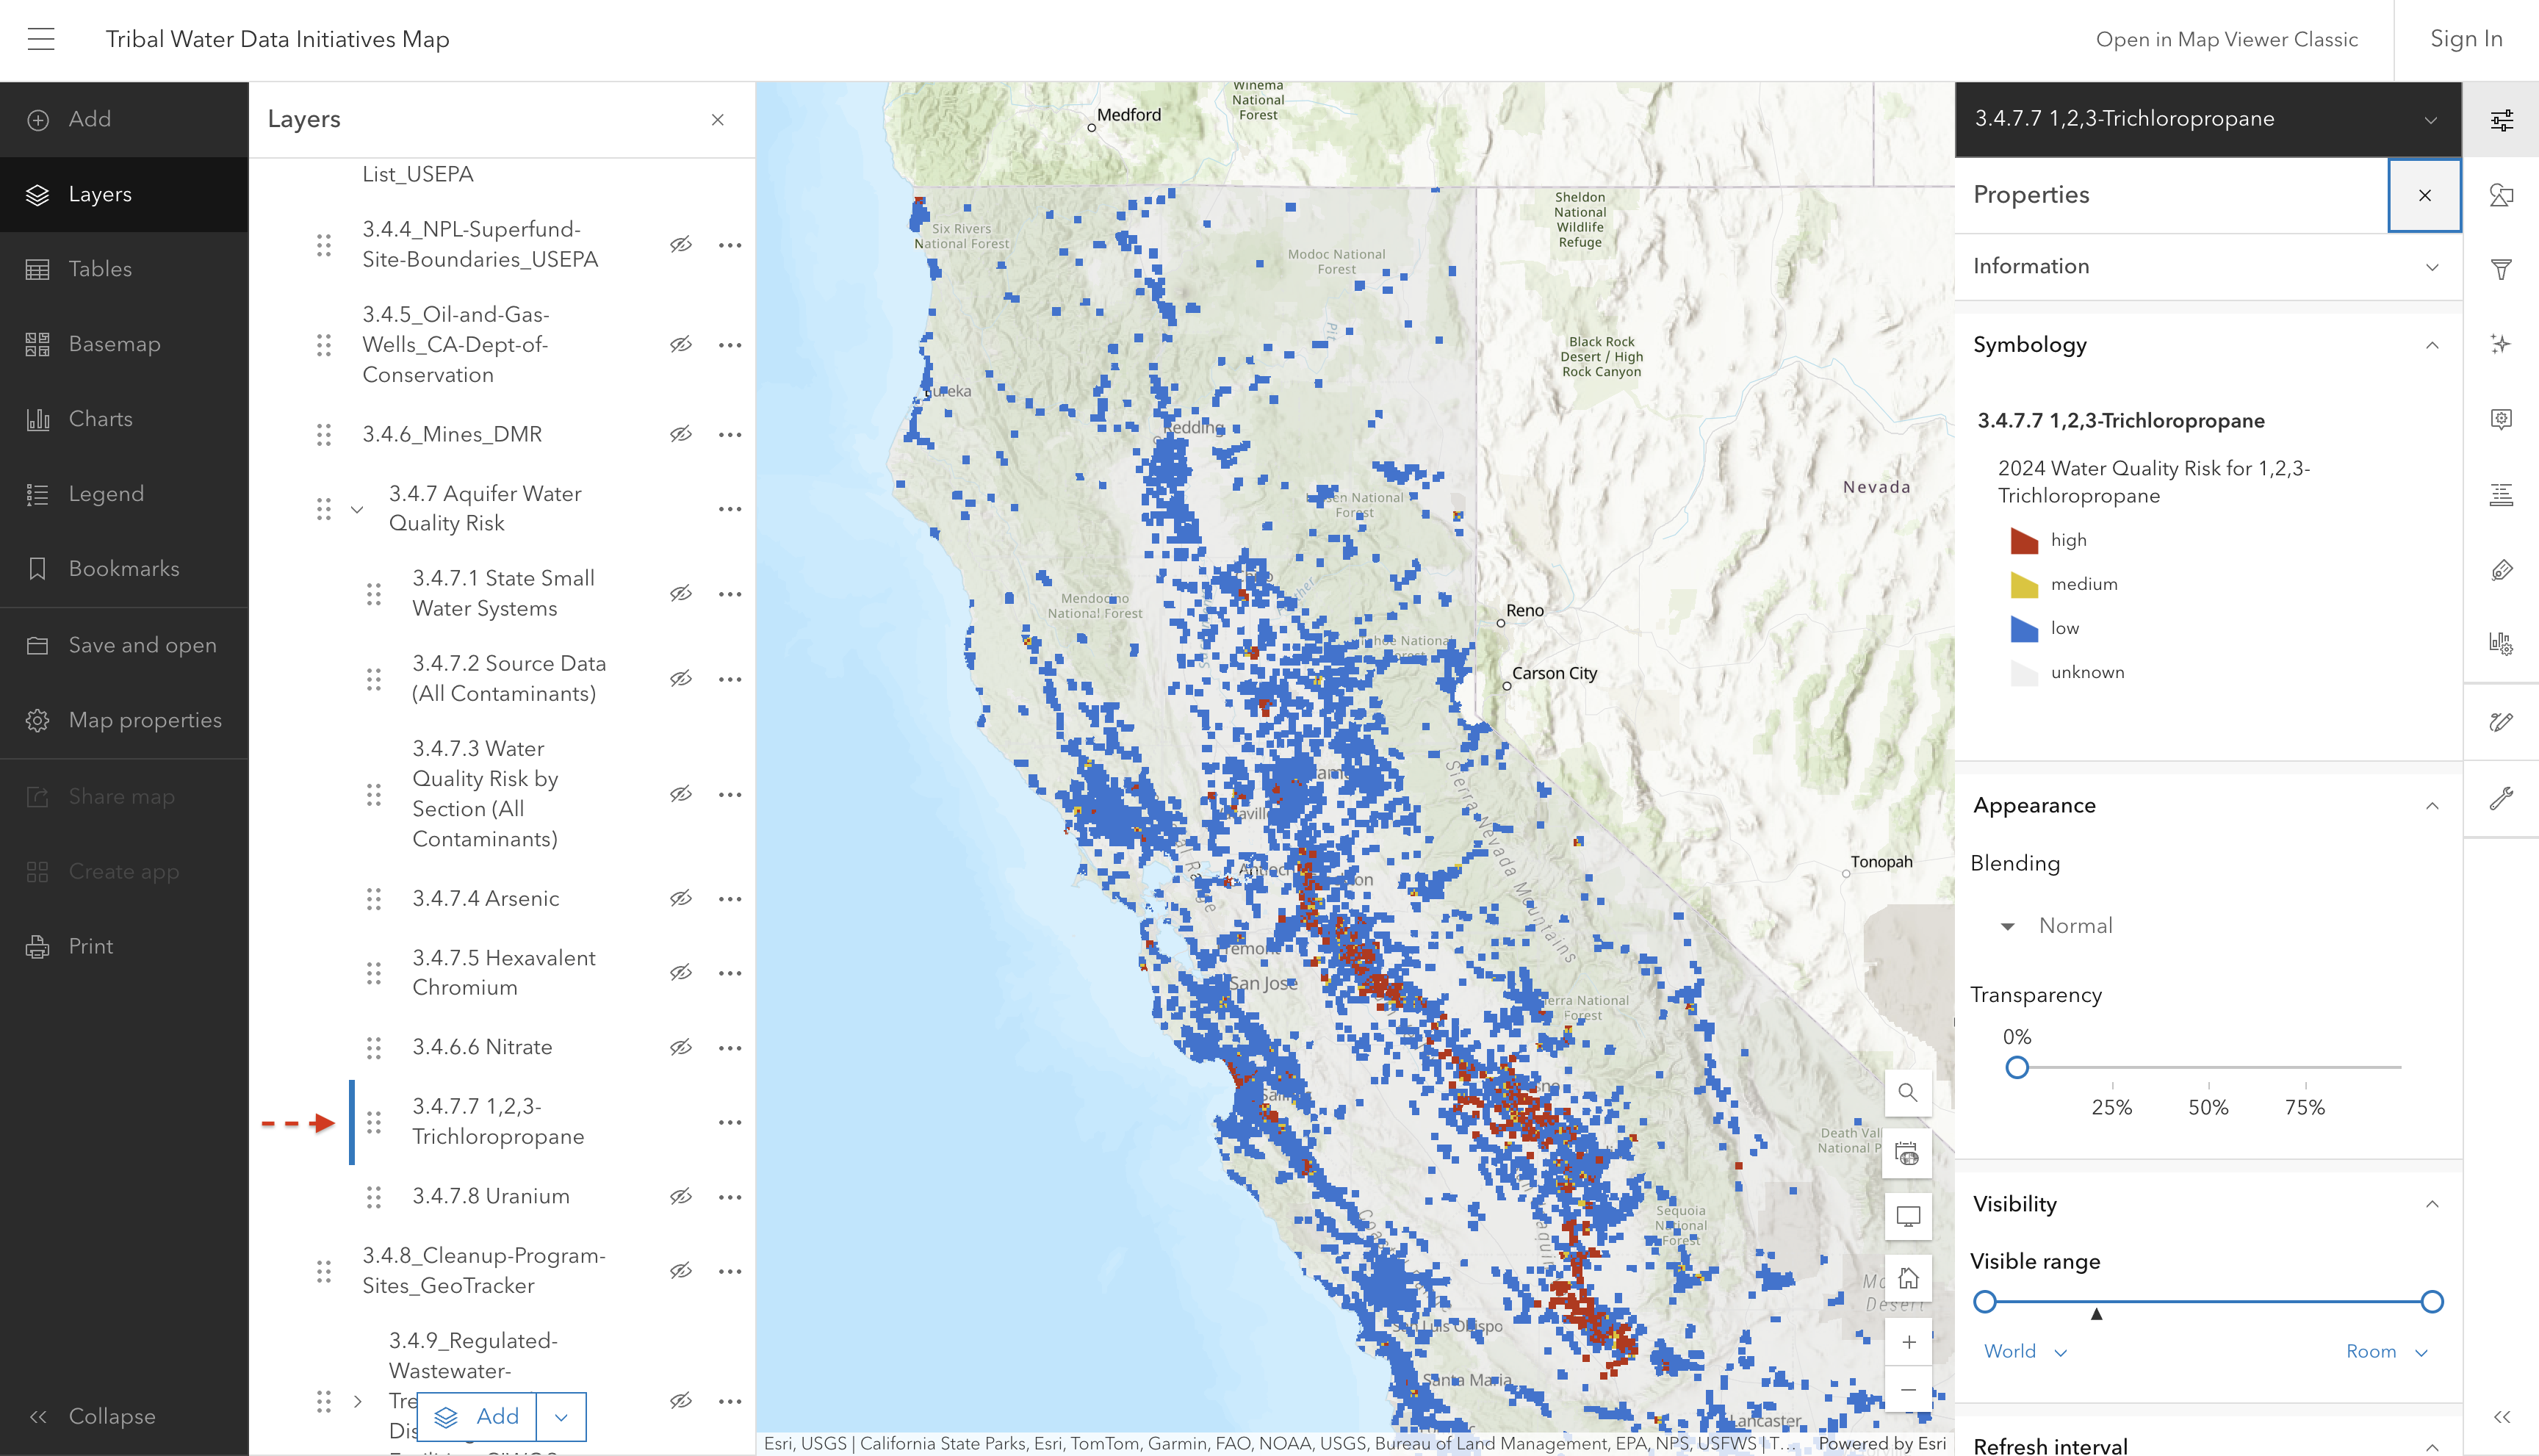
3.4.7.7 Tricholoropropane

Screenshot of interactive map showing trichloropropane risk

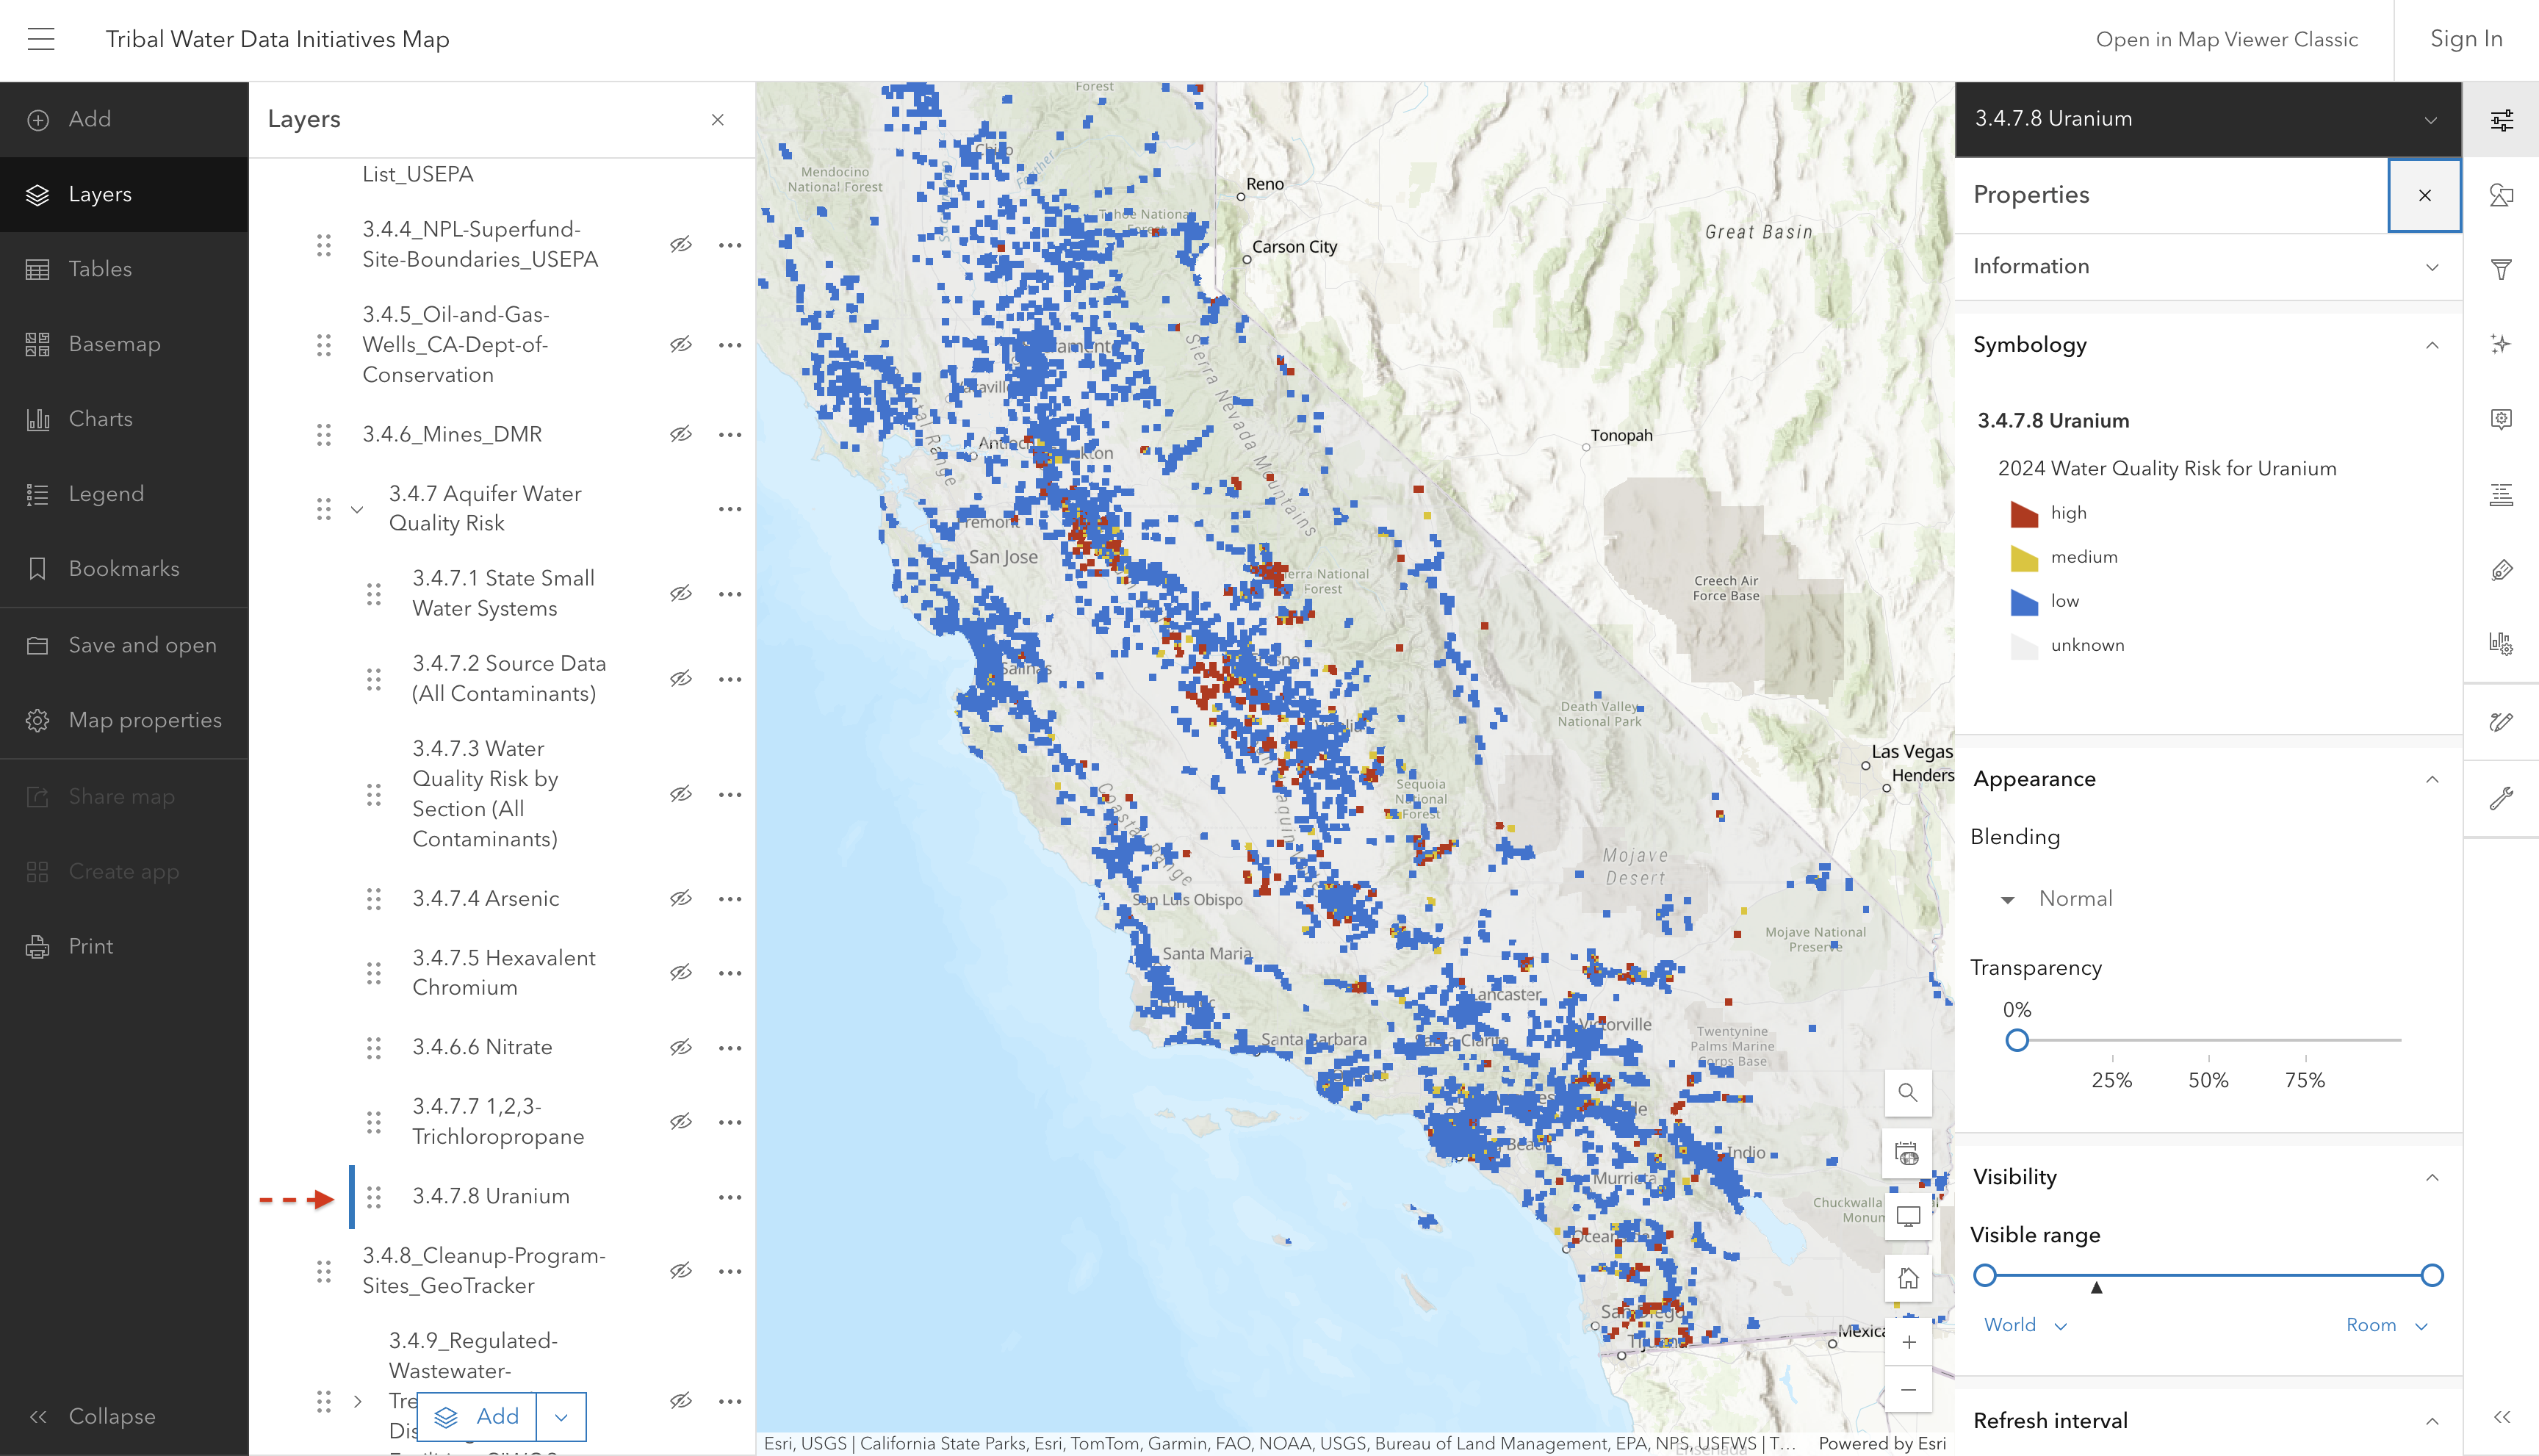
3.4.7.8 Uranium

Screenshot of interactive map showing uranium risk

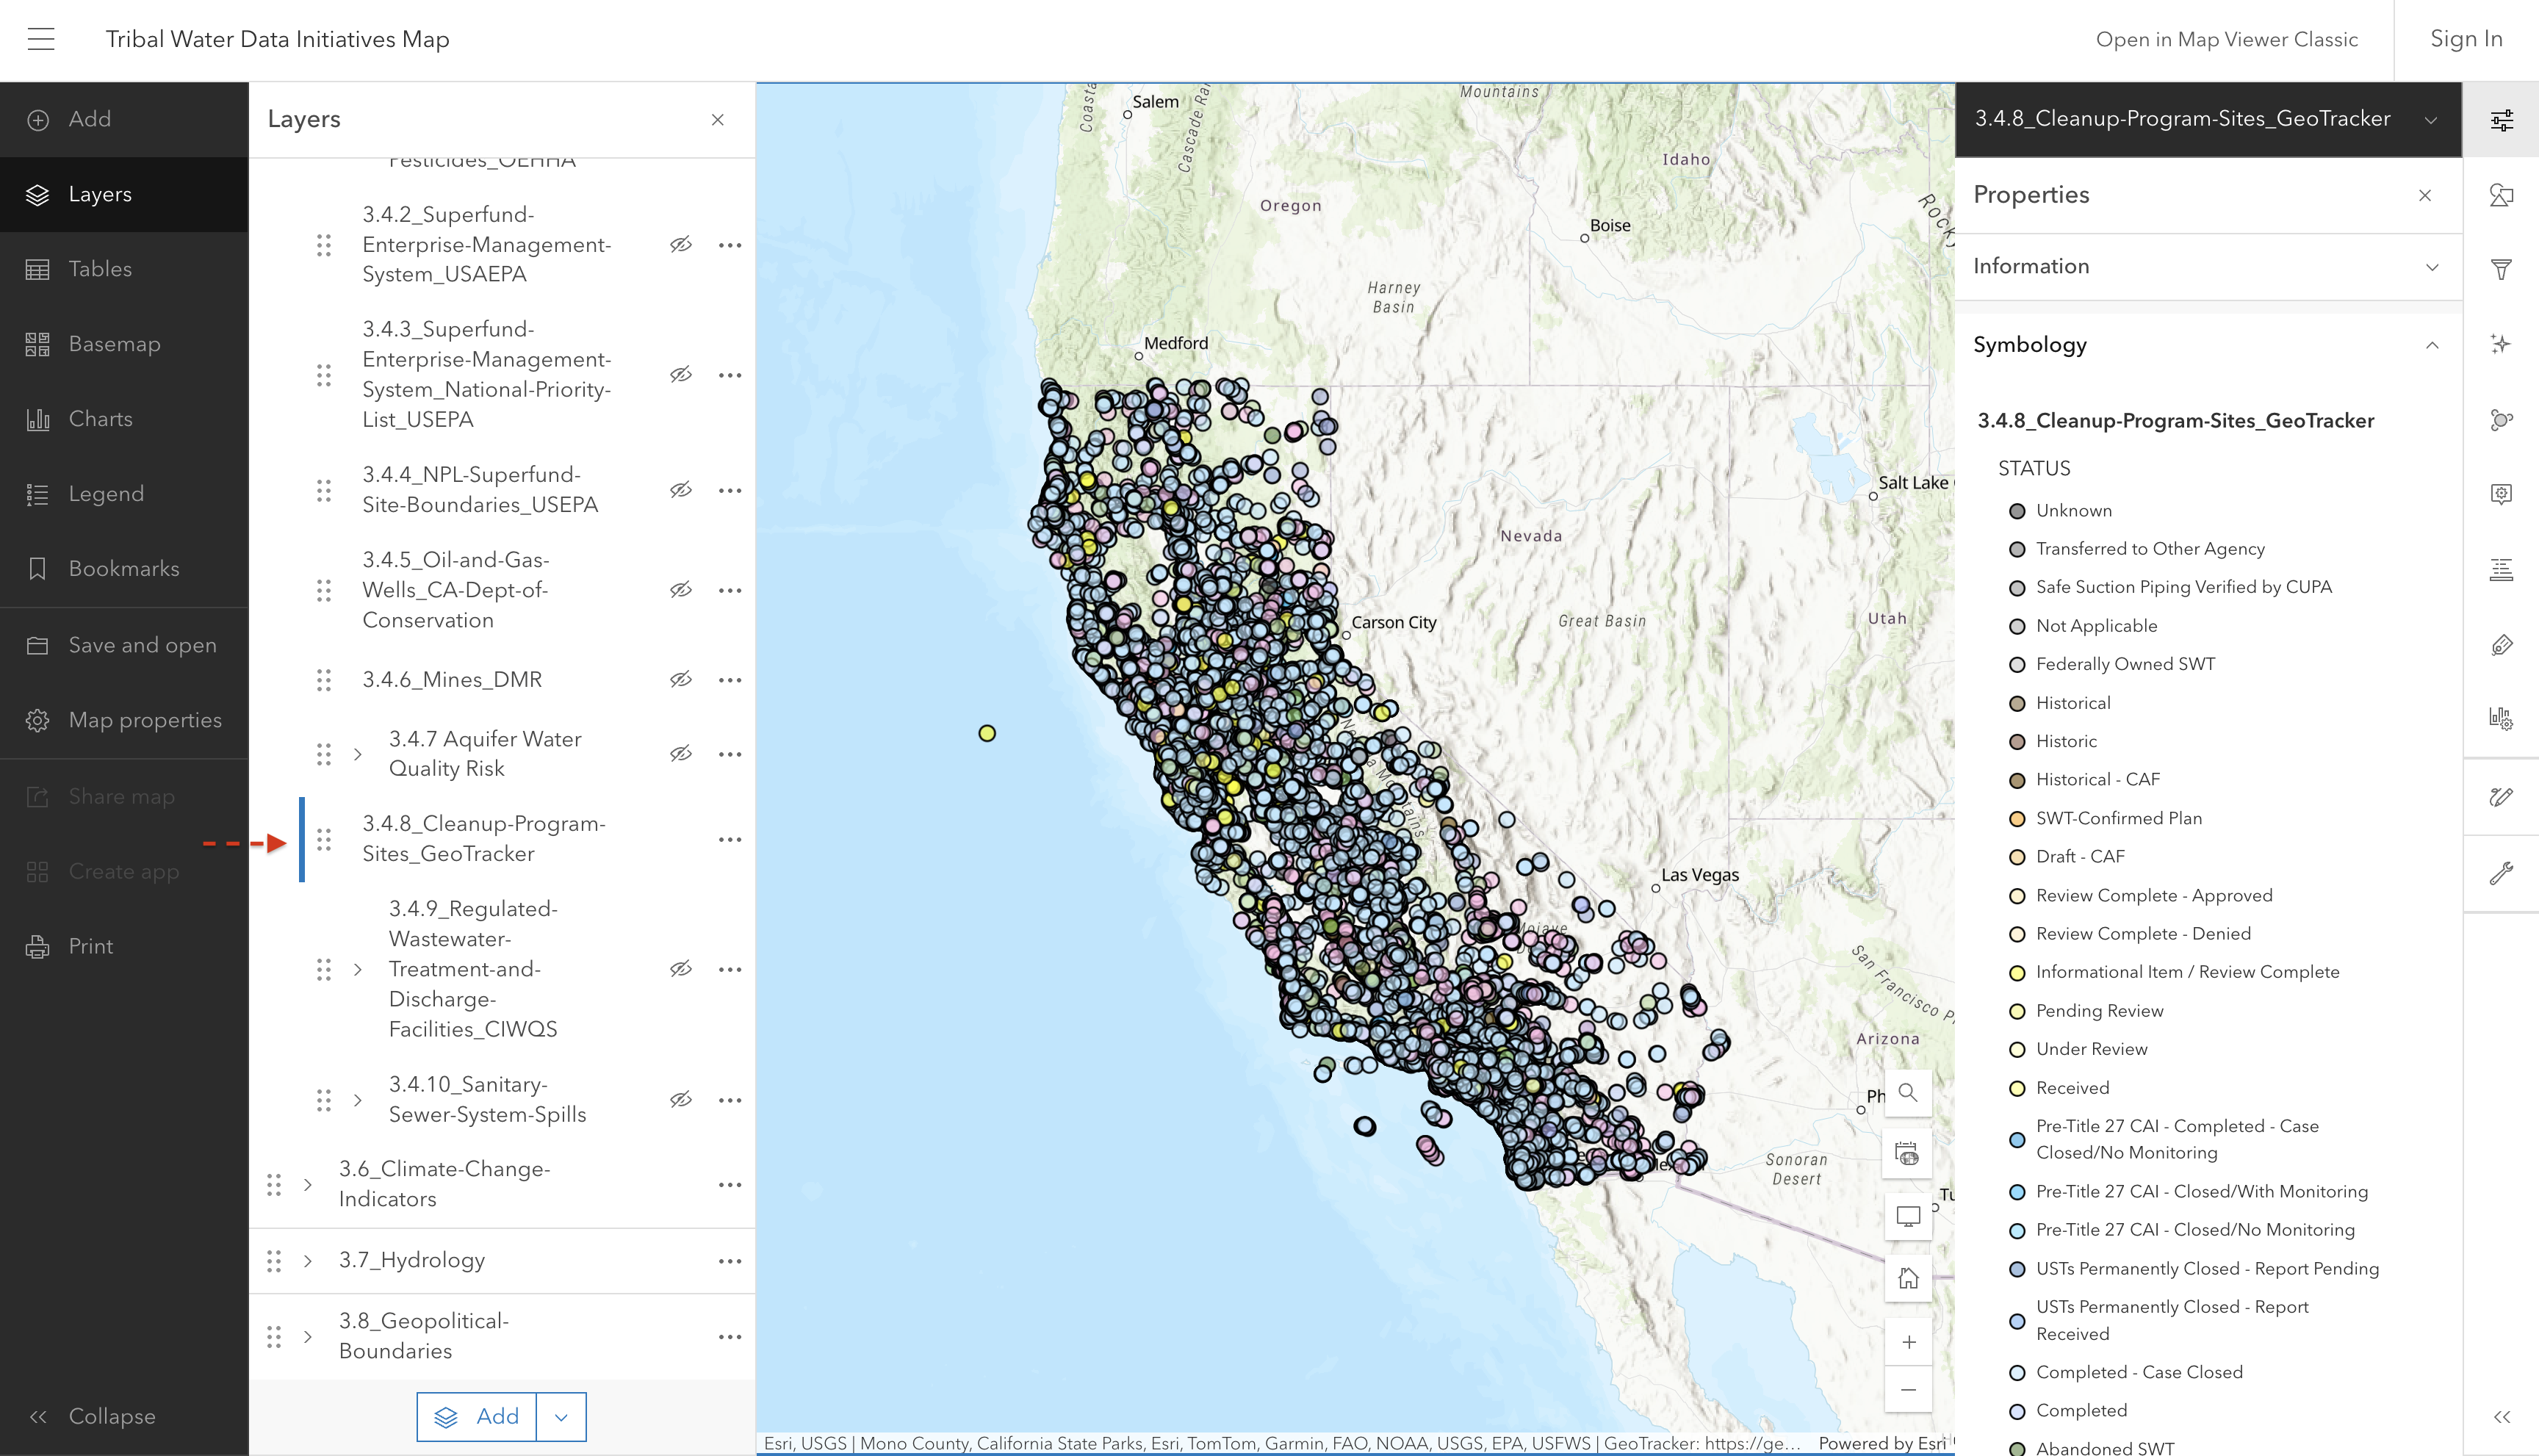
3.4.8 Cleanup Program Sites

Note

The Cleanup Program Sites have 36 different classifications. For ease of viewing on this map, we have combined similar classifications into groups. You can find the specific classification if you click on the individual point of interest, or you can refer here for the full list.

Screenshot of interactive map showing cleanup program sites

Source: GeoTracker

Source update frequency: Daily

manually updated here June 2025

Contact: GeoTracker

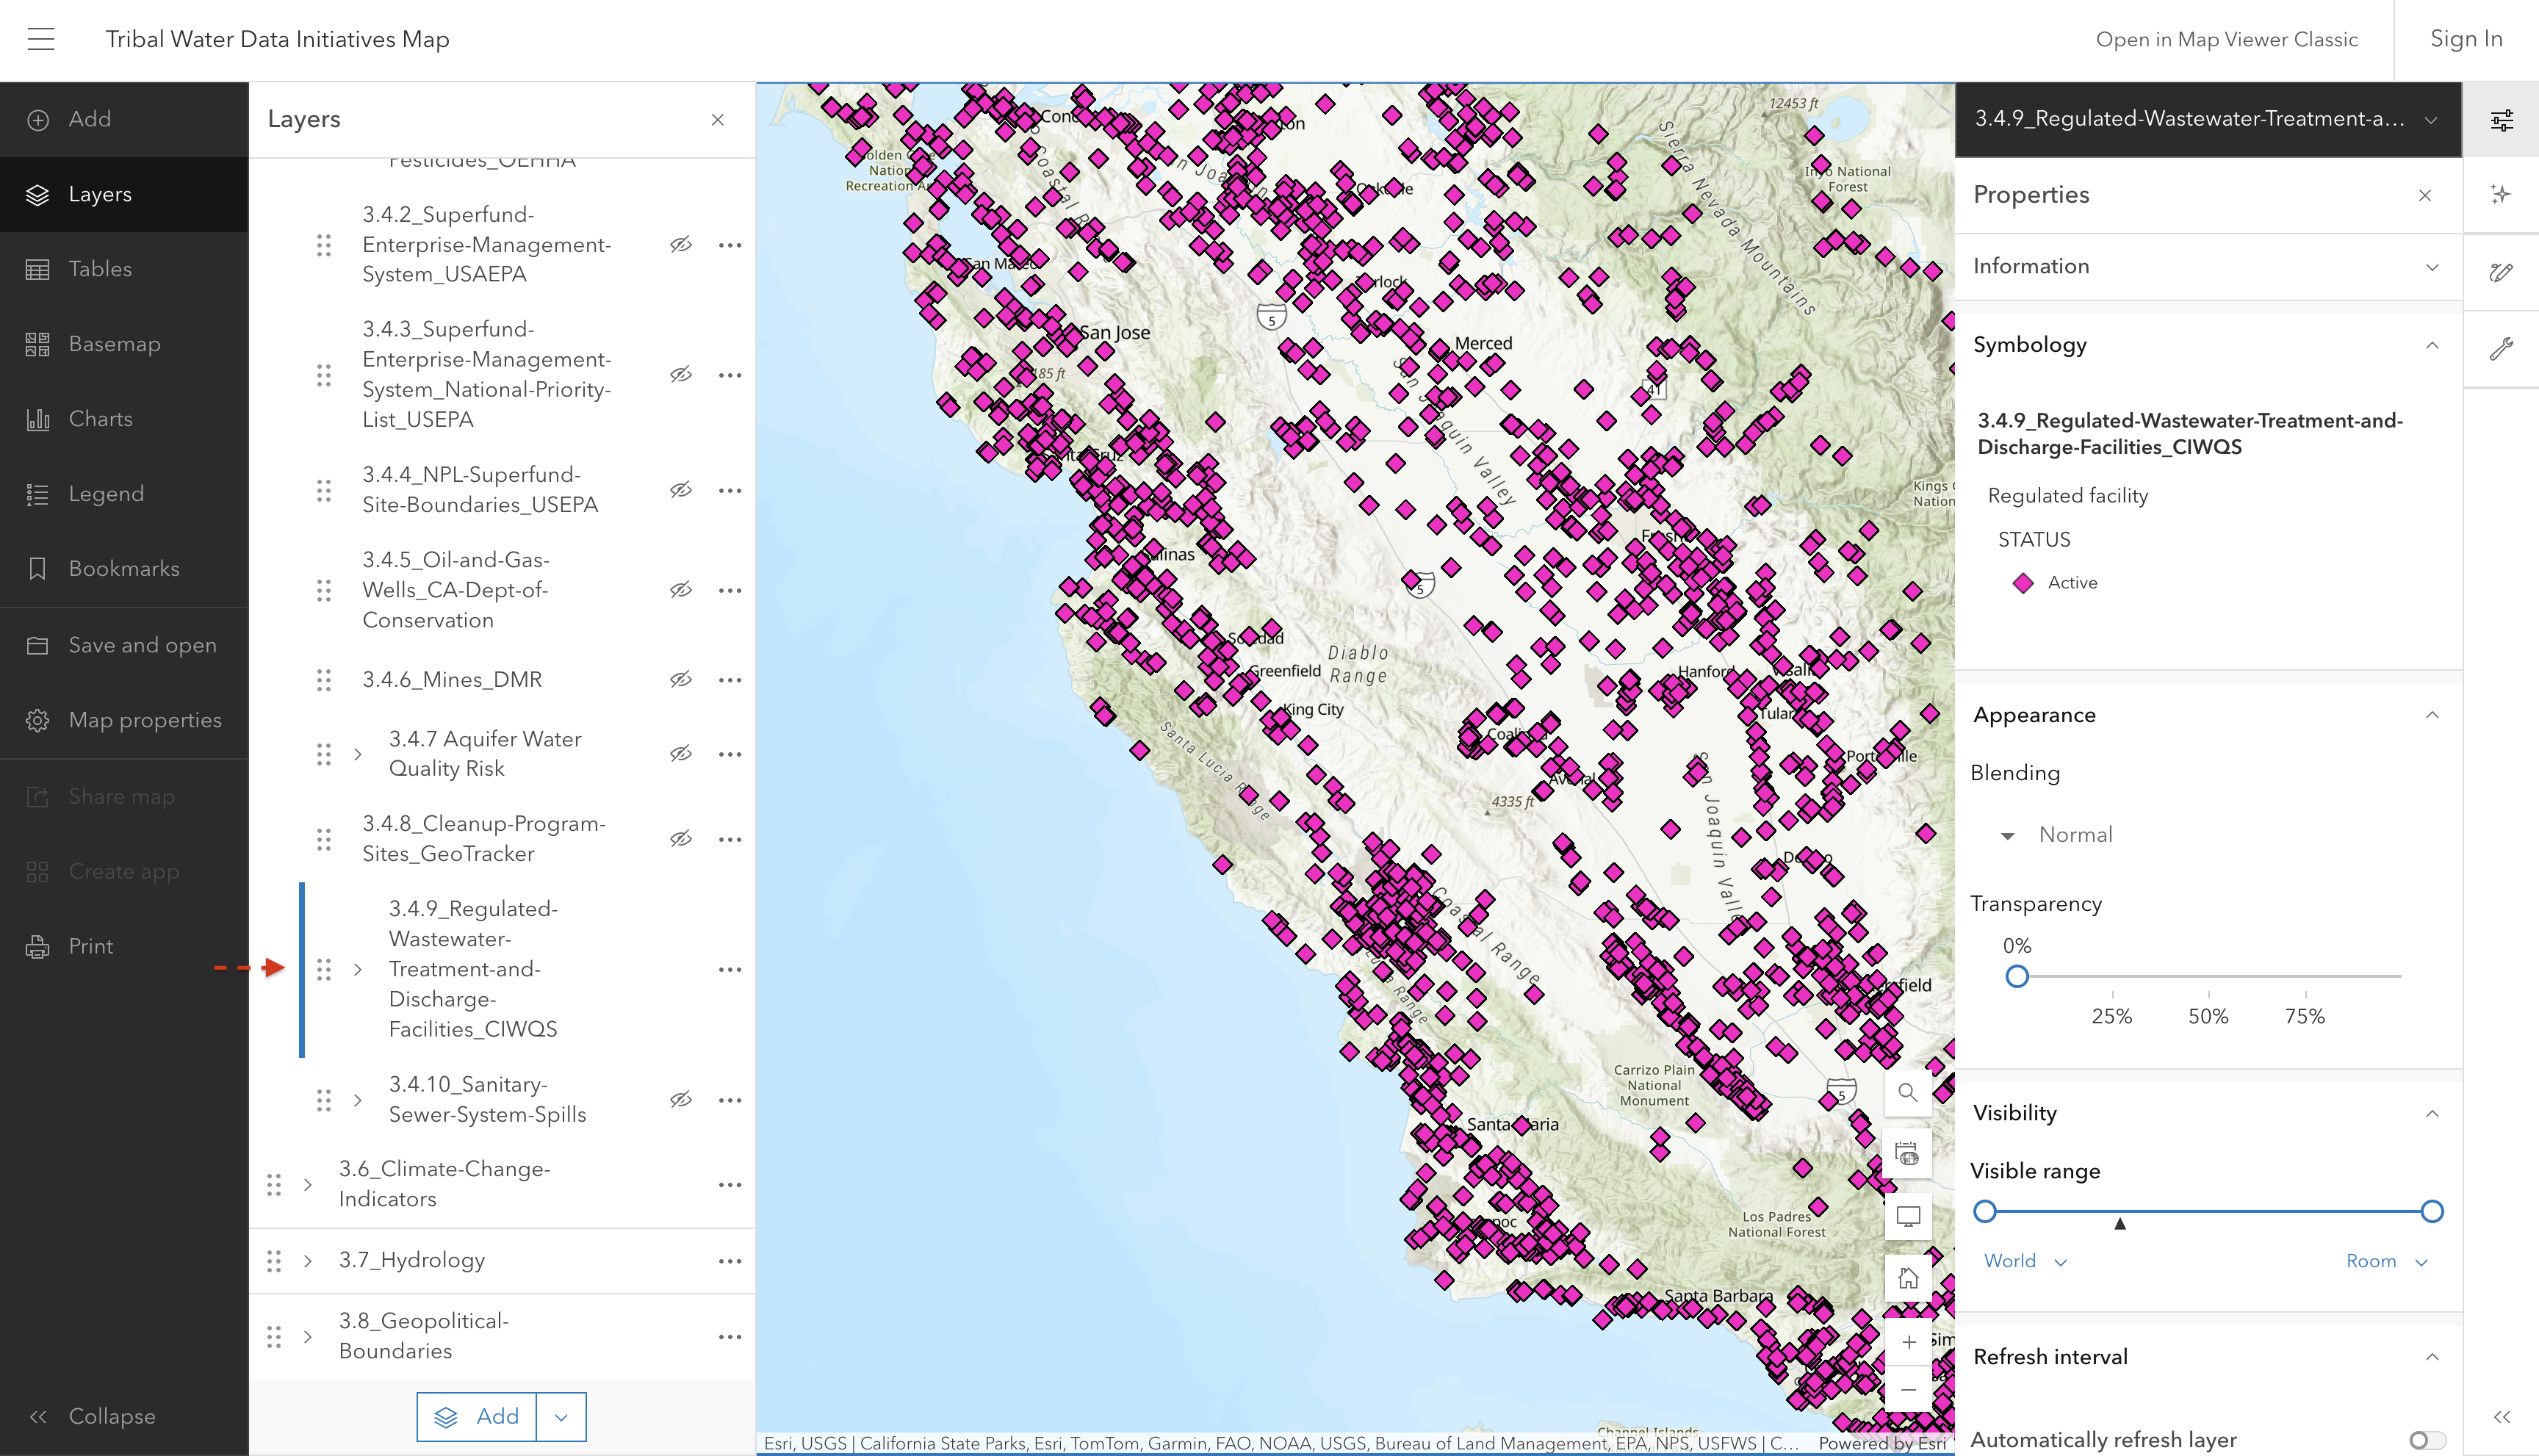
3.4.9 Regulated Wastewater Treatment & Discharge Facilities

Layer showing National Pollutant Discharge Elimination System (NPDES) and Waste Discharge Requirements (WDR) facilities regulated by State Water Board programs, as reflected in the California Integrated Water Quality System (CIWQS) project.

Screenshot of interactive map showing wastewater discharge facilities

These facilities are mandated to hold active permits to discharge into or alter the surface or ground water. More information about these permits can be found in the CIWQS database.

Source: California Integrated Water Quality System (CIWQS)

Source update frequency: Daily

automatically synced here

Contact: California Integrated Water Quality System (CIWQS)

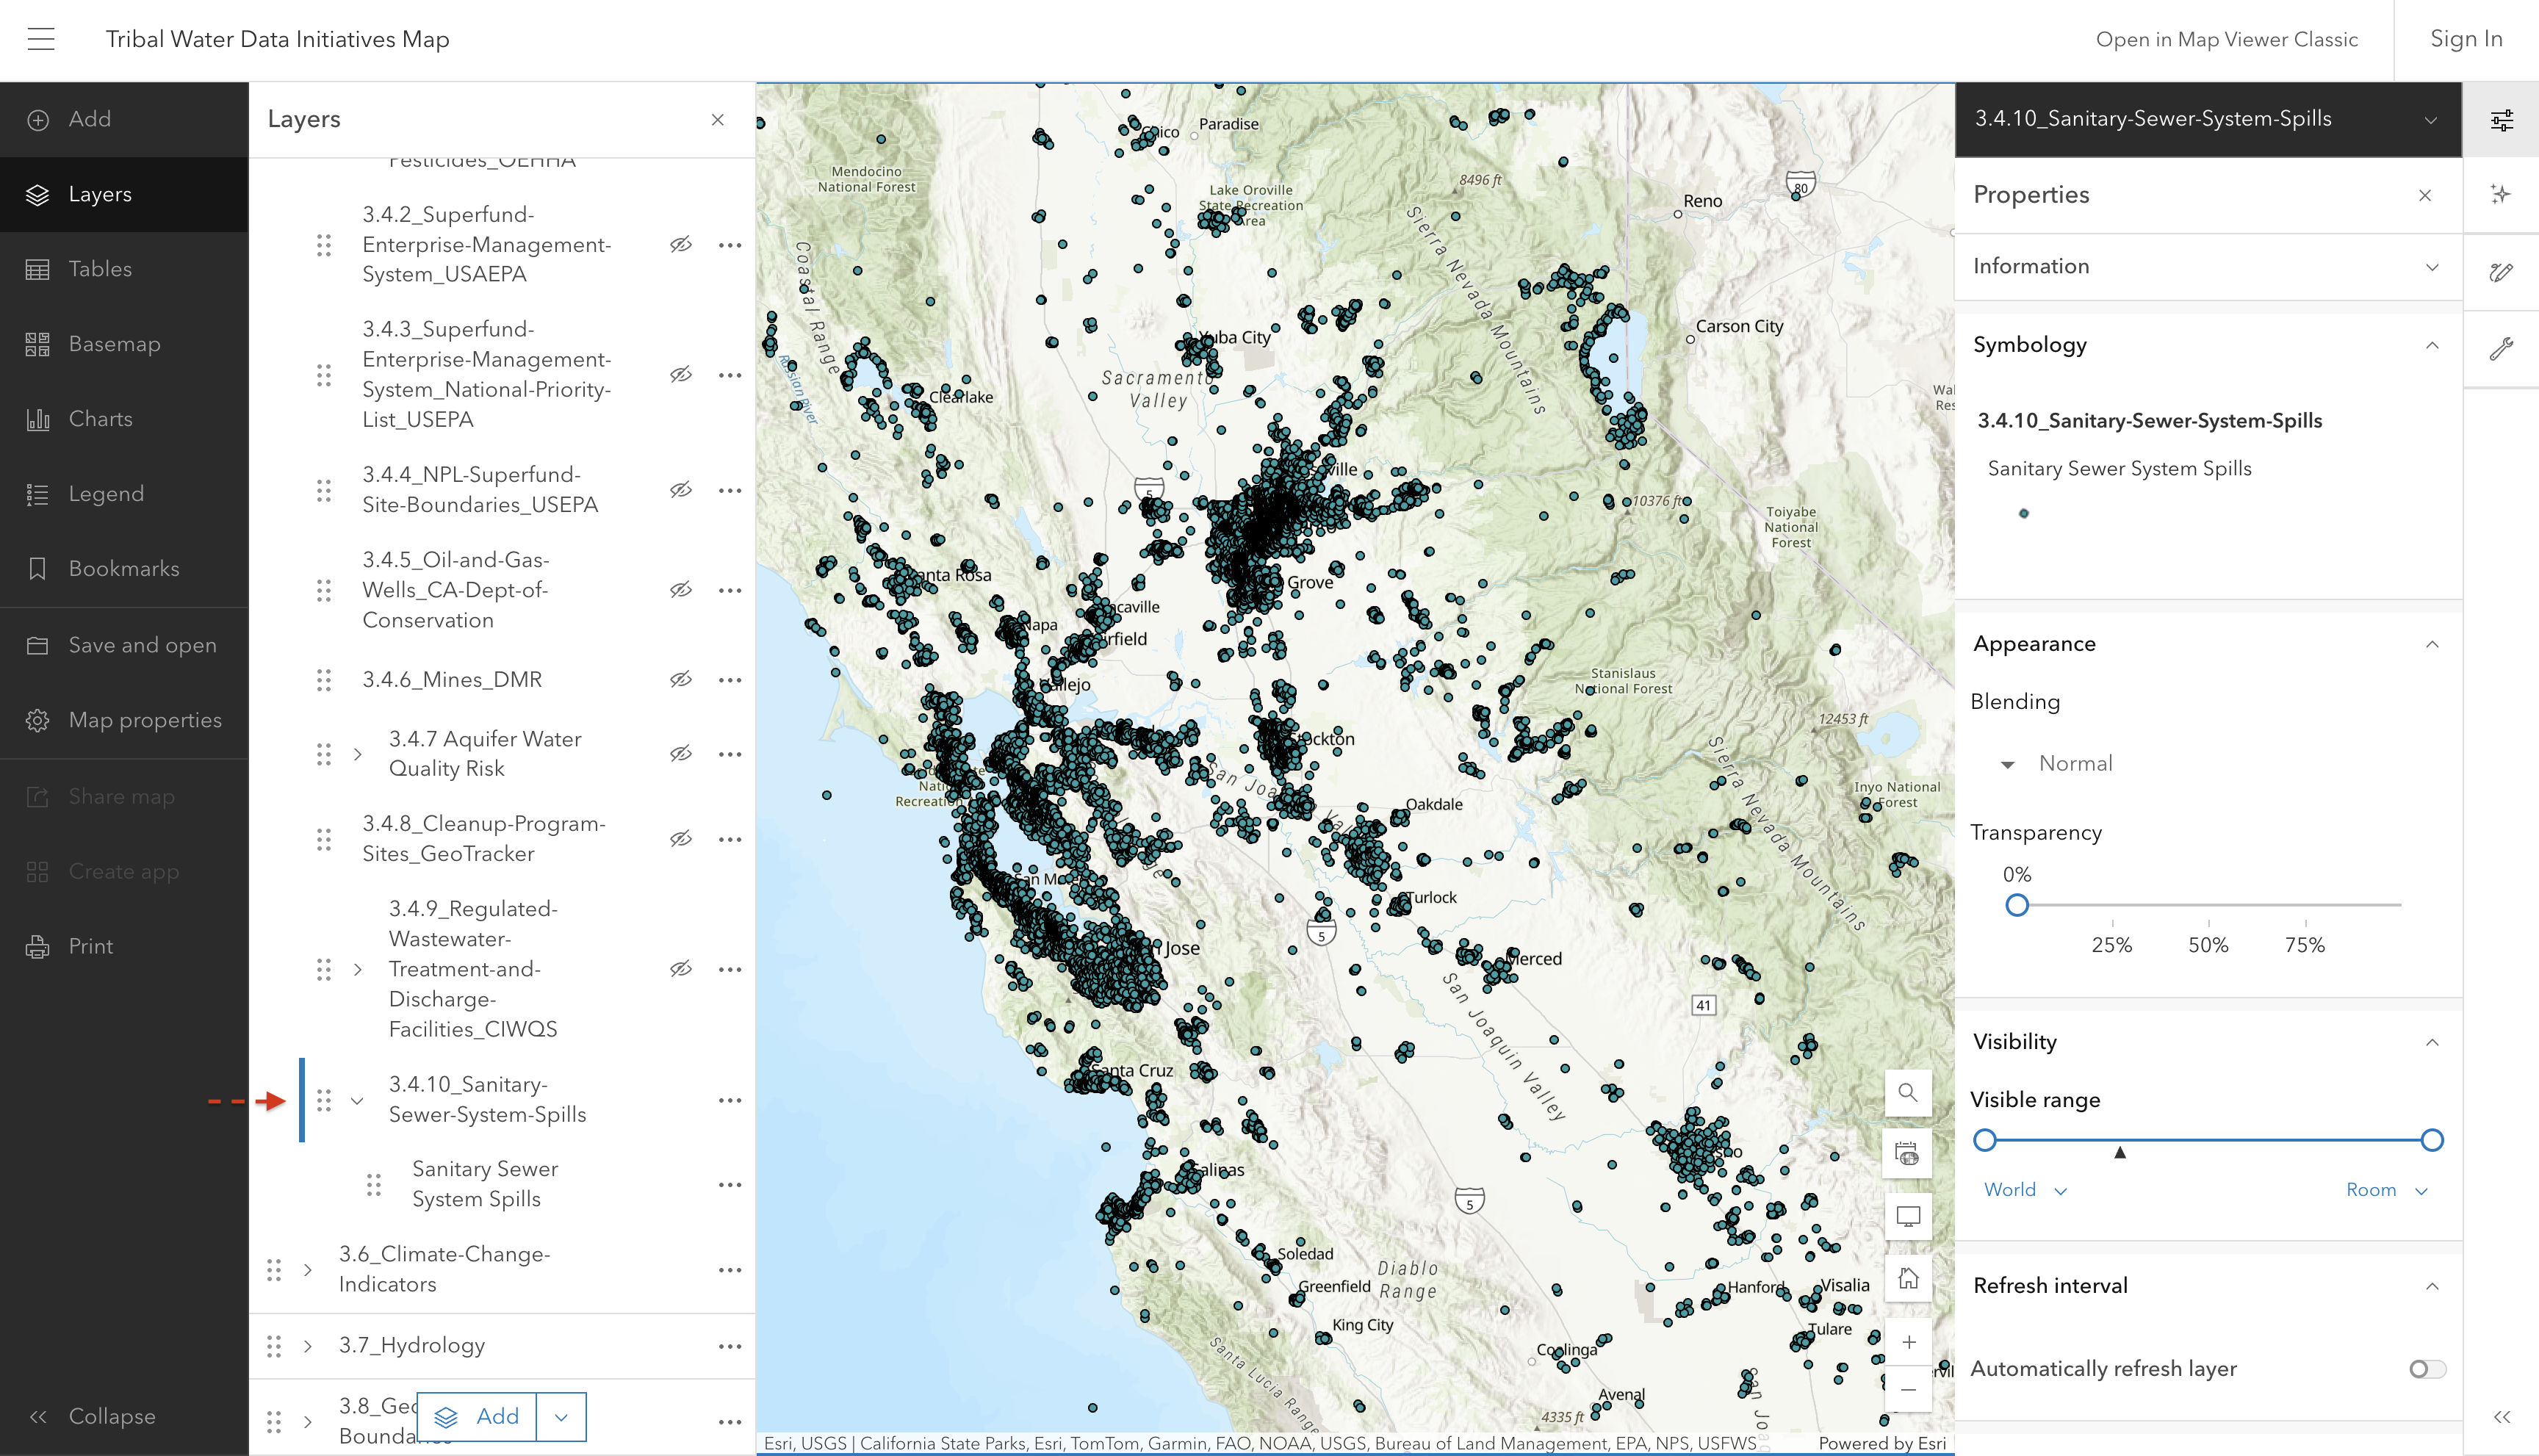
3.4.10 Sanitary Sewer System Spills

Layer showing locations with sanitary sewer system spills.

Screenshot of interactive map showing sanitary sewer system spills

Source: California Integrated Water Quality System (CIWQS)

Source update frequency: Daily

automatically synced here

Contact: California Integrated Water Quality System (CIWQS)

3.5 Water Quality

3.5.1 SWAMP Data

Note

SWAMP data are downloaded from California’s Open Data Portal and edited to refine, format, and synthesize the data before uploading it into the Tribal Water Data Map. If you are interested in seeing the raw data, please refer to the SWAMP Data Dashboard page on the California Open Data Portal linked above. There is also additional information regarding data sourced from California Environmental Data Exchange Network (CEDEN), data dictionaries, metadata, and related resources.

3.5.1.1 Tissue Summary:

The tissue summary data set includes annual summary statistics of contaminant concentrations in aquatic organism tissue samples. The data are derived from raw individual and composite tissue sample results. For the purpose of this map, we have decided to filter out all contaminants other than mercury, and display the most recent data collected from each site.

Symbology is aligned with the thresholds used by the Office of Environmental Health Hazard Assessment (OEHHA). Each site contains multiple records with different species, and therefore, different mercury concentrations. The color represented on the map is from the first species recorded at the site.

Note

Make sure to look at each individual species report to check the mercury concentrations, as the color representing the general category of OEHHA thresholds may not accurately represent each species at every site.

An additional note: The Location Code column has been removed from the data set in order to streamline the information presented. However, the location code is appended to the end of the Results column data and the full length description of the location code can be found here in the data dictionary.

screenshot coming soon

Source: SWAMP Data Dashboard - Dataset - California Open Data

Metadata: SWAMP Data Dashboard - Dataset - California Open Data

Source update frequency: As needed, as of October 2025 updates to all SWAMP data layers is static and conducted manually. Future goals are to automate this process so updates can occur with greater frequency.

manually updated here October 2025

Contact: swamp@waterboards.ca.gov

3.5.1.2 Water Quality:

The SWAMP water quality data includes field and lab analysis results for chemical and physical parameters measured in water samples.

Some of the columns have been removed from the data set for a more streamlined presentation on the map. If you are interested in seeing the full data set, please refer to the source link below. Additionally, if you are seeking information regarding what each column means/what data it is communicating, please refer to the data dictionary.

screenshot coming soon

Source: SWAMP Data Dashboard - Dataset - California Open Data

Metadata: SWAMP Data Dashboard - Dataset - California Open Data

Source update frequency: As needed, as of October 2025 updates to all SWAMP data layers is static and conducted manually. Future goals are to automate this process so updates can occur with greater frequency.

manually updated here October 2025

Contact: swamp@waterboards.ca.gov

3.5.1.3 Toxicity Summary:

The SWAMP toxicity summary data includes summarized results from aquatic toxicity tests. Summary records are entries in the database that summarize the results from multiple replicate toxicity tests of the same sample water.

screenshot coming soon

Source: SWAMP Data Dashboard - Dataset - California Open Data

Metadata: SWAMP Data Dashboard - Dataset - California Open Data

Source update frequency: As needed, as of October 2025 updates to all SWAMP data layers is static and conducted manually. Future goals are to automate this process so updates can occur with greater frequency.

manually updated here October 2025

Contact: swamp@waterboards.ca.gov

3.5.1.4 Habitat:

The SWAMP habitat results includes data on physical habitat conditions typically collected alongside biological monitoring to provide context for interpreting water quality conditions. This data set includes scores for the California Stream Condition Index (CSCI) and Algal Stream Condition Index (ASCI).

screenshot coming soon

Source: SWAMP Data Dashboard - Dataset - California Open Data

Metadata: SWAMP Data Dashboard - Dataset - California Open Data

Source update frequency: As needed, as of October 2025 updates to all SWAMP data layers is static and conducted manually. Future goals are to automate this process so updates can occur with greater frequency.

manually updated here October 2025

Contact: swamp@waterboards.ca.gov

3.6 Climate Change Indicators

3.6.1 Vulnerable Communities Platform

The Vulnerable Communities Platform (VCP) was developed by the California Governor’s Office of Land Use and Climate Innovation to help identify communities that may face greater challenges from extreme heat, drought, flooding, and sea level rise. These layers show where climate hazards overlap with social and economic conditions that can make it harder for communities to prepare for, respond to, and recover from their impacts.

Map colors show combinations of low, medium, and high climate hazard and social vulnerability. Users can also view climate hazards and social vulnerability separately. These layers can help inform climate adaptation planning, identify areas for further assessment, and support funding applications.

[Screenshot Coming Soon: Screenshot of interactive map showing bi-variate [hazard] climate hazard and social vulnerability]

NoteHow to read the two-variable (bivariate) map.

This map uses color to show climate hazard and social vulnerability together. Each square in the legend represents a different combination, for example, high climate hazard and low social vulnerability, or high levels of both.

To read the map, match an area’s color to a square in the legend, then follow the labels along both axes to identify its hazard and social vulnerability levels. Neither measure alone tells the whole story: an area with low social vulnerability can still face high climate hazard. The single-variable layers can be used to explore climate hazard or social vulnerability separately.

[Screenshot Coming Soon: Screenshot of interactive map showing [hazard] climate hazard]

NoteSingle-variable layers:

These layers show climate hazard or social vulnerability on its own. Colors represent low, medium, and high levels of the selected measure; use the legend to identify each category. For example, a high classification in a hazard-only layer indicates high climate hazard, without accounting for social vulnerability.

[Screenshot Coming Soon: Screenshot of interactive map showing social vulnerability to [hazard]]

NoteWhat does social vulnerability mean?

Social vulnerability describes conditions that can increase a community’s sensitivity to climate hazards or limit its ability to prepare and recover. Each social vulnerability layer combines factors relevant to its specific hazard. Shared factors include income, disability, age, access to basic needs, and social support. Other factors vary by hazard, so a community’s social vulnerability classification may differ across layers.

NoteA note on “current” and “2050”: What the layers show and how they’re modeled.

“Current” does not represent one collection year across all layers. Some indicators use climate estimates covering a range of years; others use mapped hazard areas or supporting data collected at different times. The future layers labeled “2050” represent the periods or conditions described below.

Hazard Model or approach Current conditions Future conditions labeled “2050”
Extreme heat LOCA2 CA Hybrid climate projections using the high-emissions scenario SSP3-7.0. Indicators include days above 100°F and unusually hot nights. Climate estimates for 2015–2044. Climate estimates for 2045–2074.
Drought LOCA2 CA Hybrid summer temperature projections using SSP3-7.0, combined with water shortage vulnerability and indicators of water availability relative to population and cultivated land. Summer temperature estimates for 2015–2044, combined with supporting indicators. Summer temperature estimates for 2045–2074, combined with the same supporting indicators.
Flooding California Department of Water Resources Best Available Maps of floodplains, combined with LOCA2 CA Hybrid heavy-rainfall projections using SSP3-7.0. 100-year floodplains, combined with rainfall estimates for 2015–2044. 500-year floodplains, combined with rainfall estimates for 2045–2074.
Sea level rise California’s intermediate sea level rise scenario, using CoSMoS modeling and substitute NOAA and Delta Adapts data where needed. Indicators include coastal flooding, shallow groundwater, cliff retreat, and shoreline erosion. Modeled conditions with no additional sea level rise, generally including a 100-year storm. Approximately 0.8 feet of sea level rise, generally including a 100-year storm. Some substitute datasets use 1 foot; NOAA substitute data does not include the storm.

Understanding the assumptions: The extreme heat, drought, and heavy-rainfall estimates use Localized Constructed Analogs, version 2, California Hybrid (LOCA2 CA Hybrid). This method translates global climate model results into more detailed estimates for California.

These estimates use Shared Socioeconomic Pathway 3-7.0 (SSP3-7.0), a possible future with high greenhouse gas emissions and limited international cooperation. It represents one possible pathway, rather than a prediction of what will happen.

Sea level rise follows California’s intermediate scenario, with approximately 0.8 feet of additional sea level rise by 2050. The layers primarily use the Coastal Storm Modeling System (CoSMoS) to estimate coastal flooding, shallow groundwater, cliff retreat, and shoreline erosion. Where needed, the VCP supplements these estimates with data from the National Oceanic and Atmospheric Administration (NOAA) and the Delta Stewardship Council’s Delta Adapts assessment. Some substitute datasets use 1 foot of sea level rise as the closest available estimate. The modeled conditions generally include a 100-year storm, although NOAA substitute data does not include that storm.

For inland flooding, a 100-year flood has a 1% chance of occurring in any year, and a 500-year flood has a 0.2% chance. The VCP uses these mapped floodplains to represent current and future exposure, respectively. The future layer is not an exact prediction of where flooding will occur in 2050.

Social vulnerability data is not projected to 2050. Both time periods use the same social vulnerability data. The drought layers also retain the same supporting water shortage and water availability indicators in both periods.

Source: VCP Methods Report, October 2025, pages 17–27.
Source: California Vulnerable Communities Platform

Metadata: VCP Methods Report, October 2025

Source update frequency: As needed; no fixed update schedule is published.
Contact: ClimateServices@lci.ca.gov

3.7 Hydrology

3.7.1 Wetlands

The National Wetlands Inventory (NWI) was established by the US Fish and Wildlife Service (FWS) to conduct a nationwide inventory of U.S. wetlands to provide biologists and others with information on the distribution and type of wetlands to aid in conservation efforts. This layer has been clipped to just show the extent, approximate location and type of wetlands and surface water habitats in California.

Navigate here for more historic information regarding vegetation, regional and temporal conditions, and geographic features.

screenshot coming soon

Source: Wetlands Mapper | U.S. Fish & Wildlife Service

Metadata: Wetlands Metadata | U.S. Fish & Wildlife Service

Source update frequency: As needed

manually updated here September 2025

Contact: Wetlands_Team@fws.gov

3.7.2 Groundwater Basins

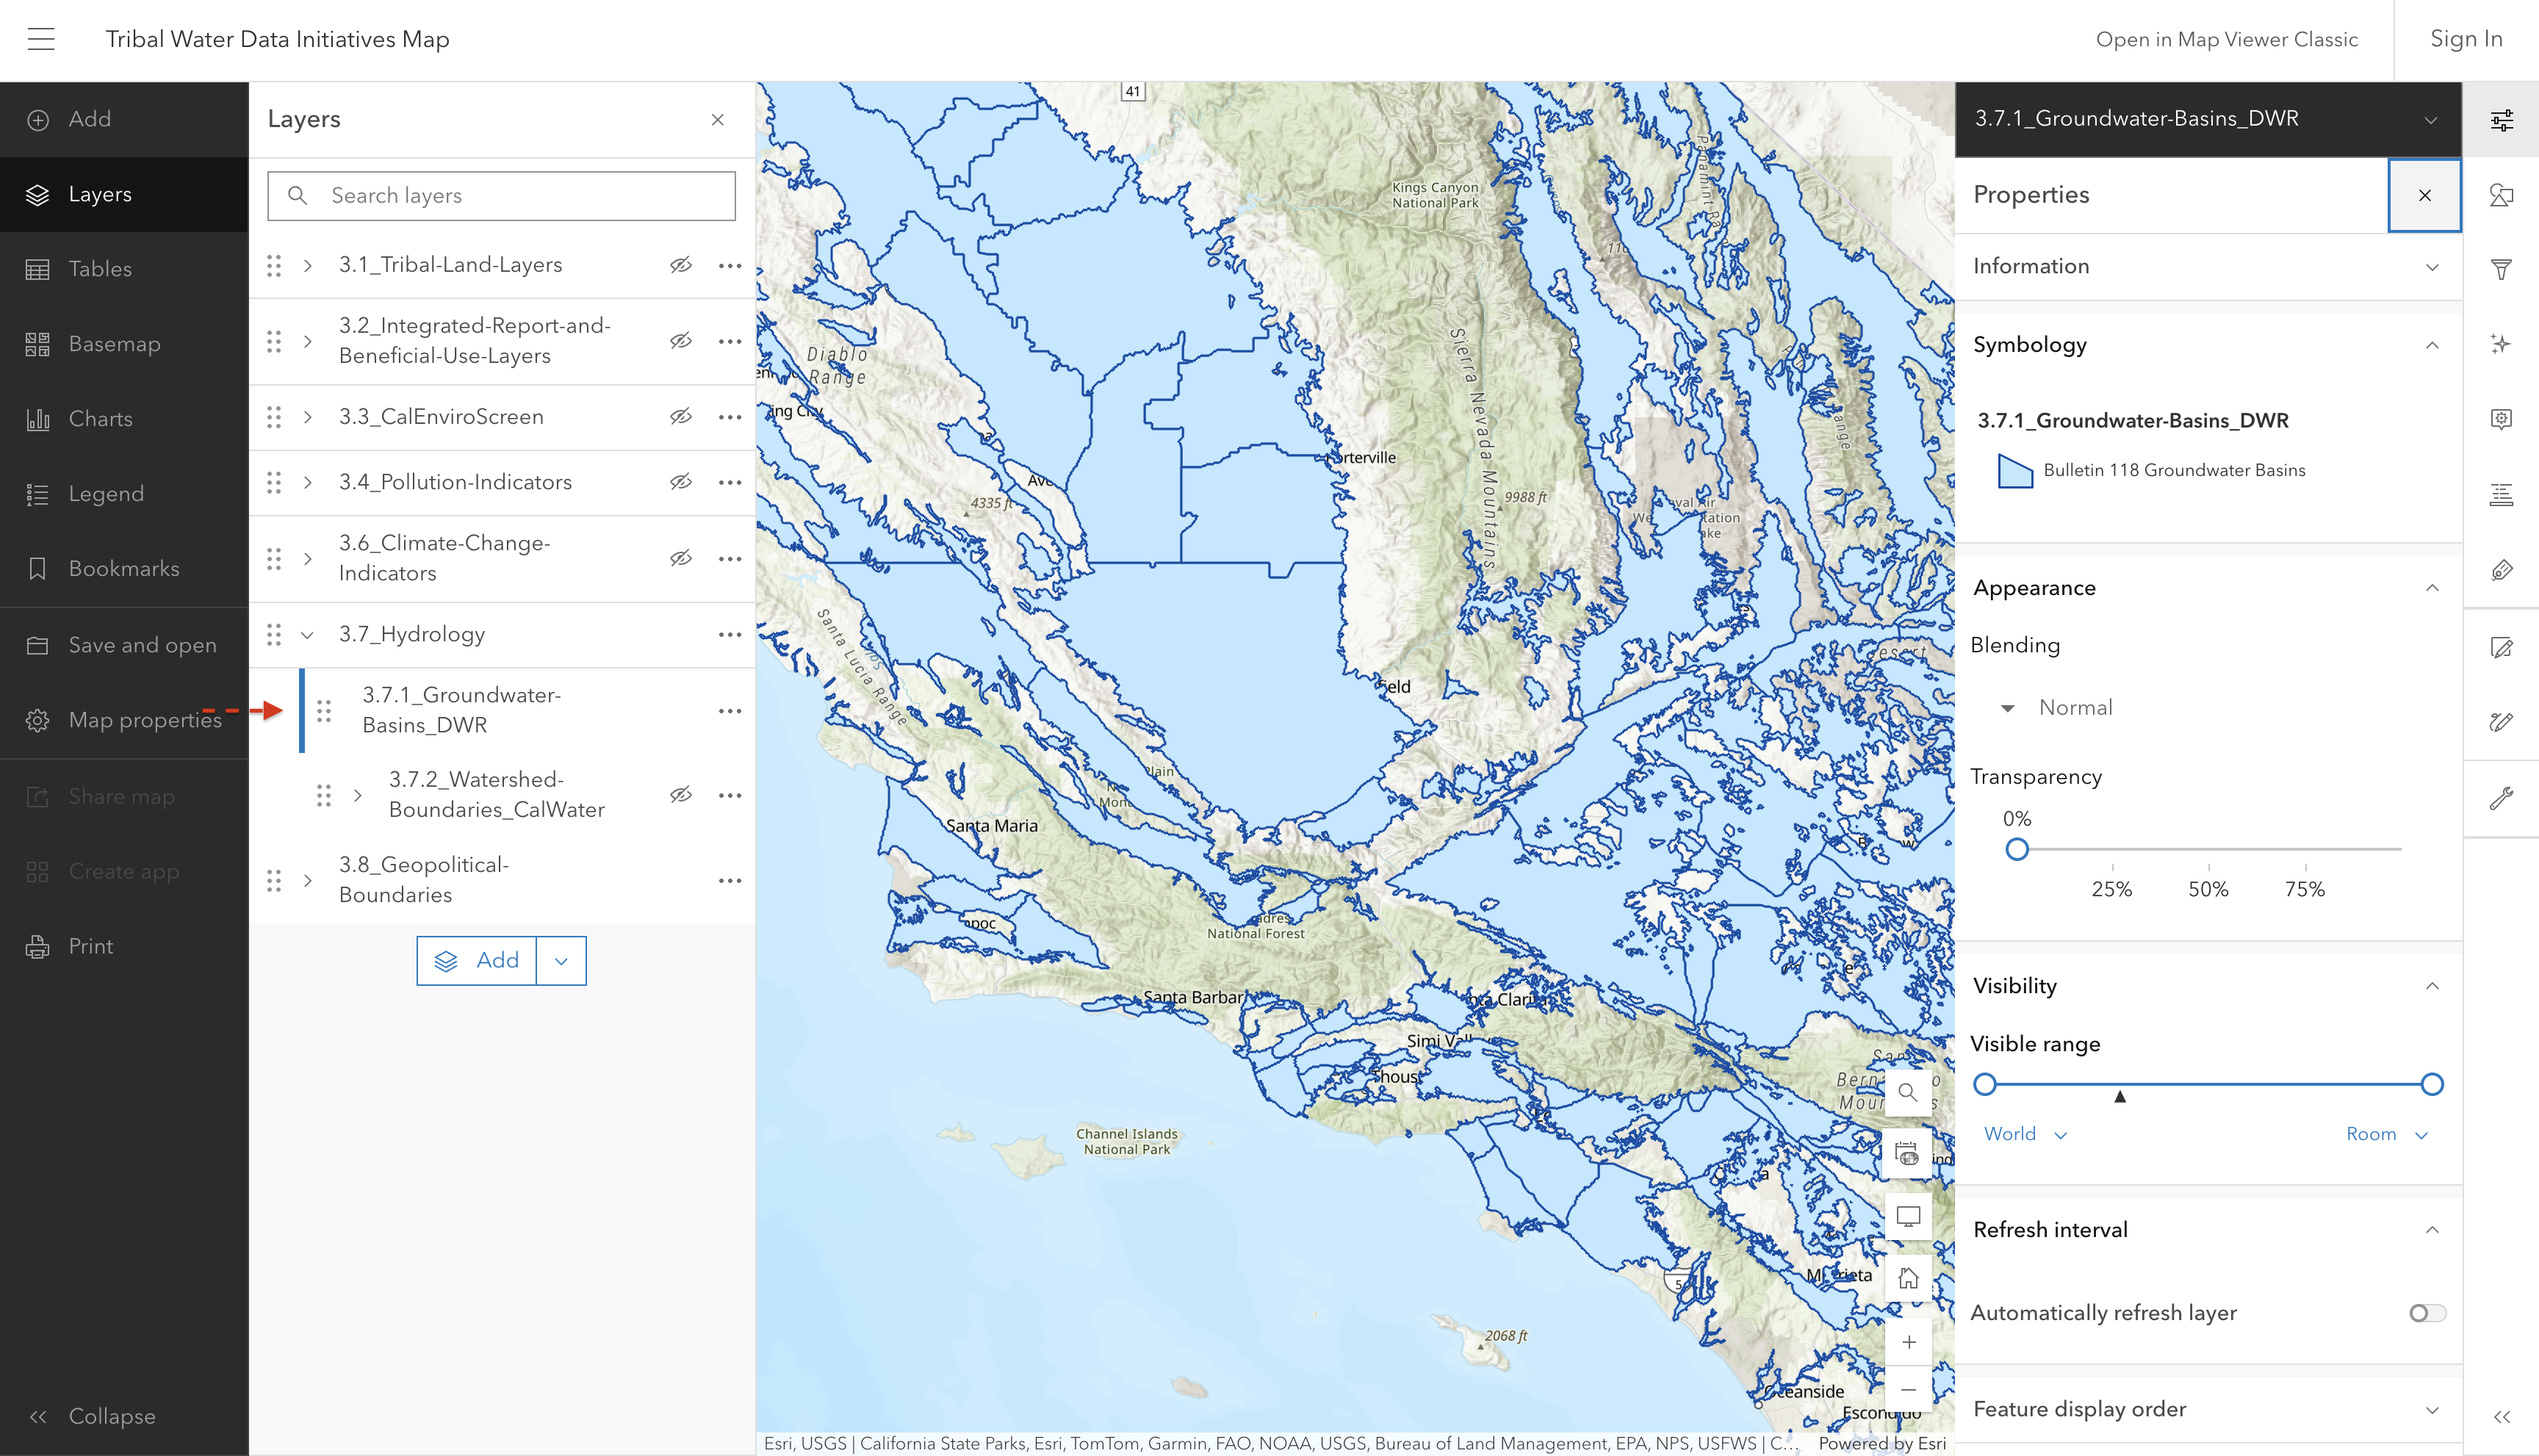
This layer shows the boundaries of 515 groundwater basins and subbasins as defined by the California Department of Water Resources.

Screenshot of interactive map showing groundwater basins and boundaries

Source: California Department of Water Resources

Source update frequency: As needed

automatically synced here

Contact: California Department of Water Resources

3.7.3 Hydrography, Water Boundaries

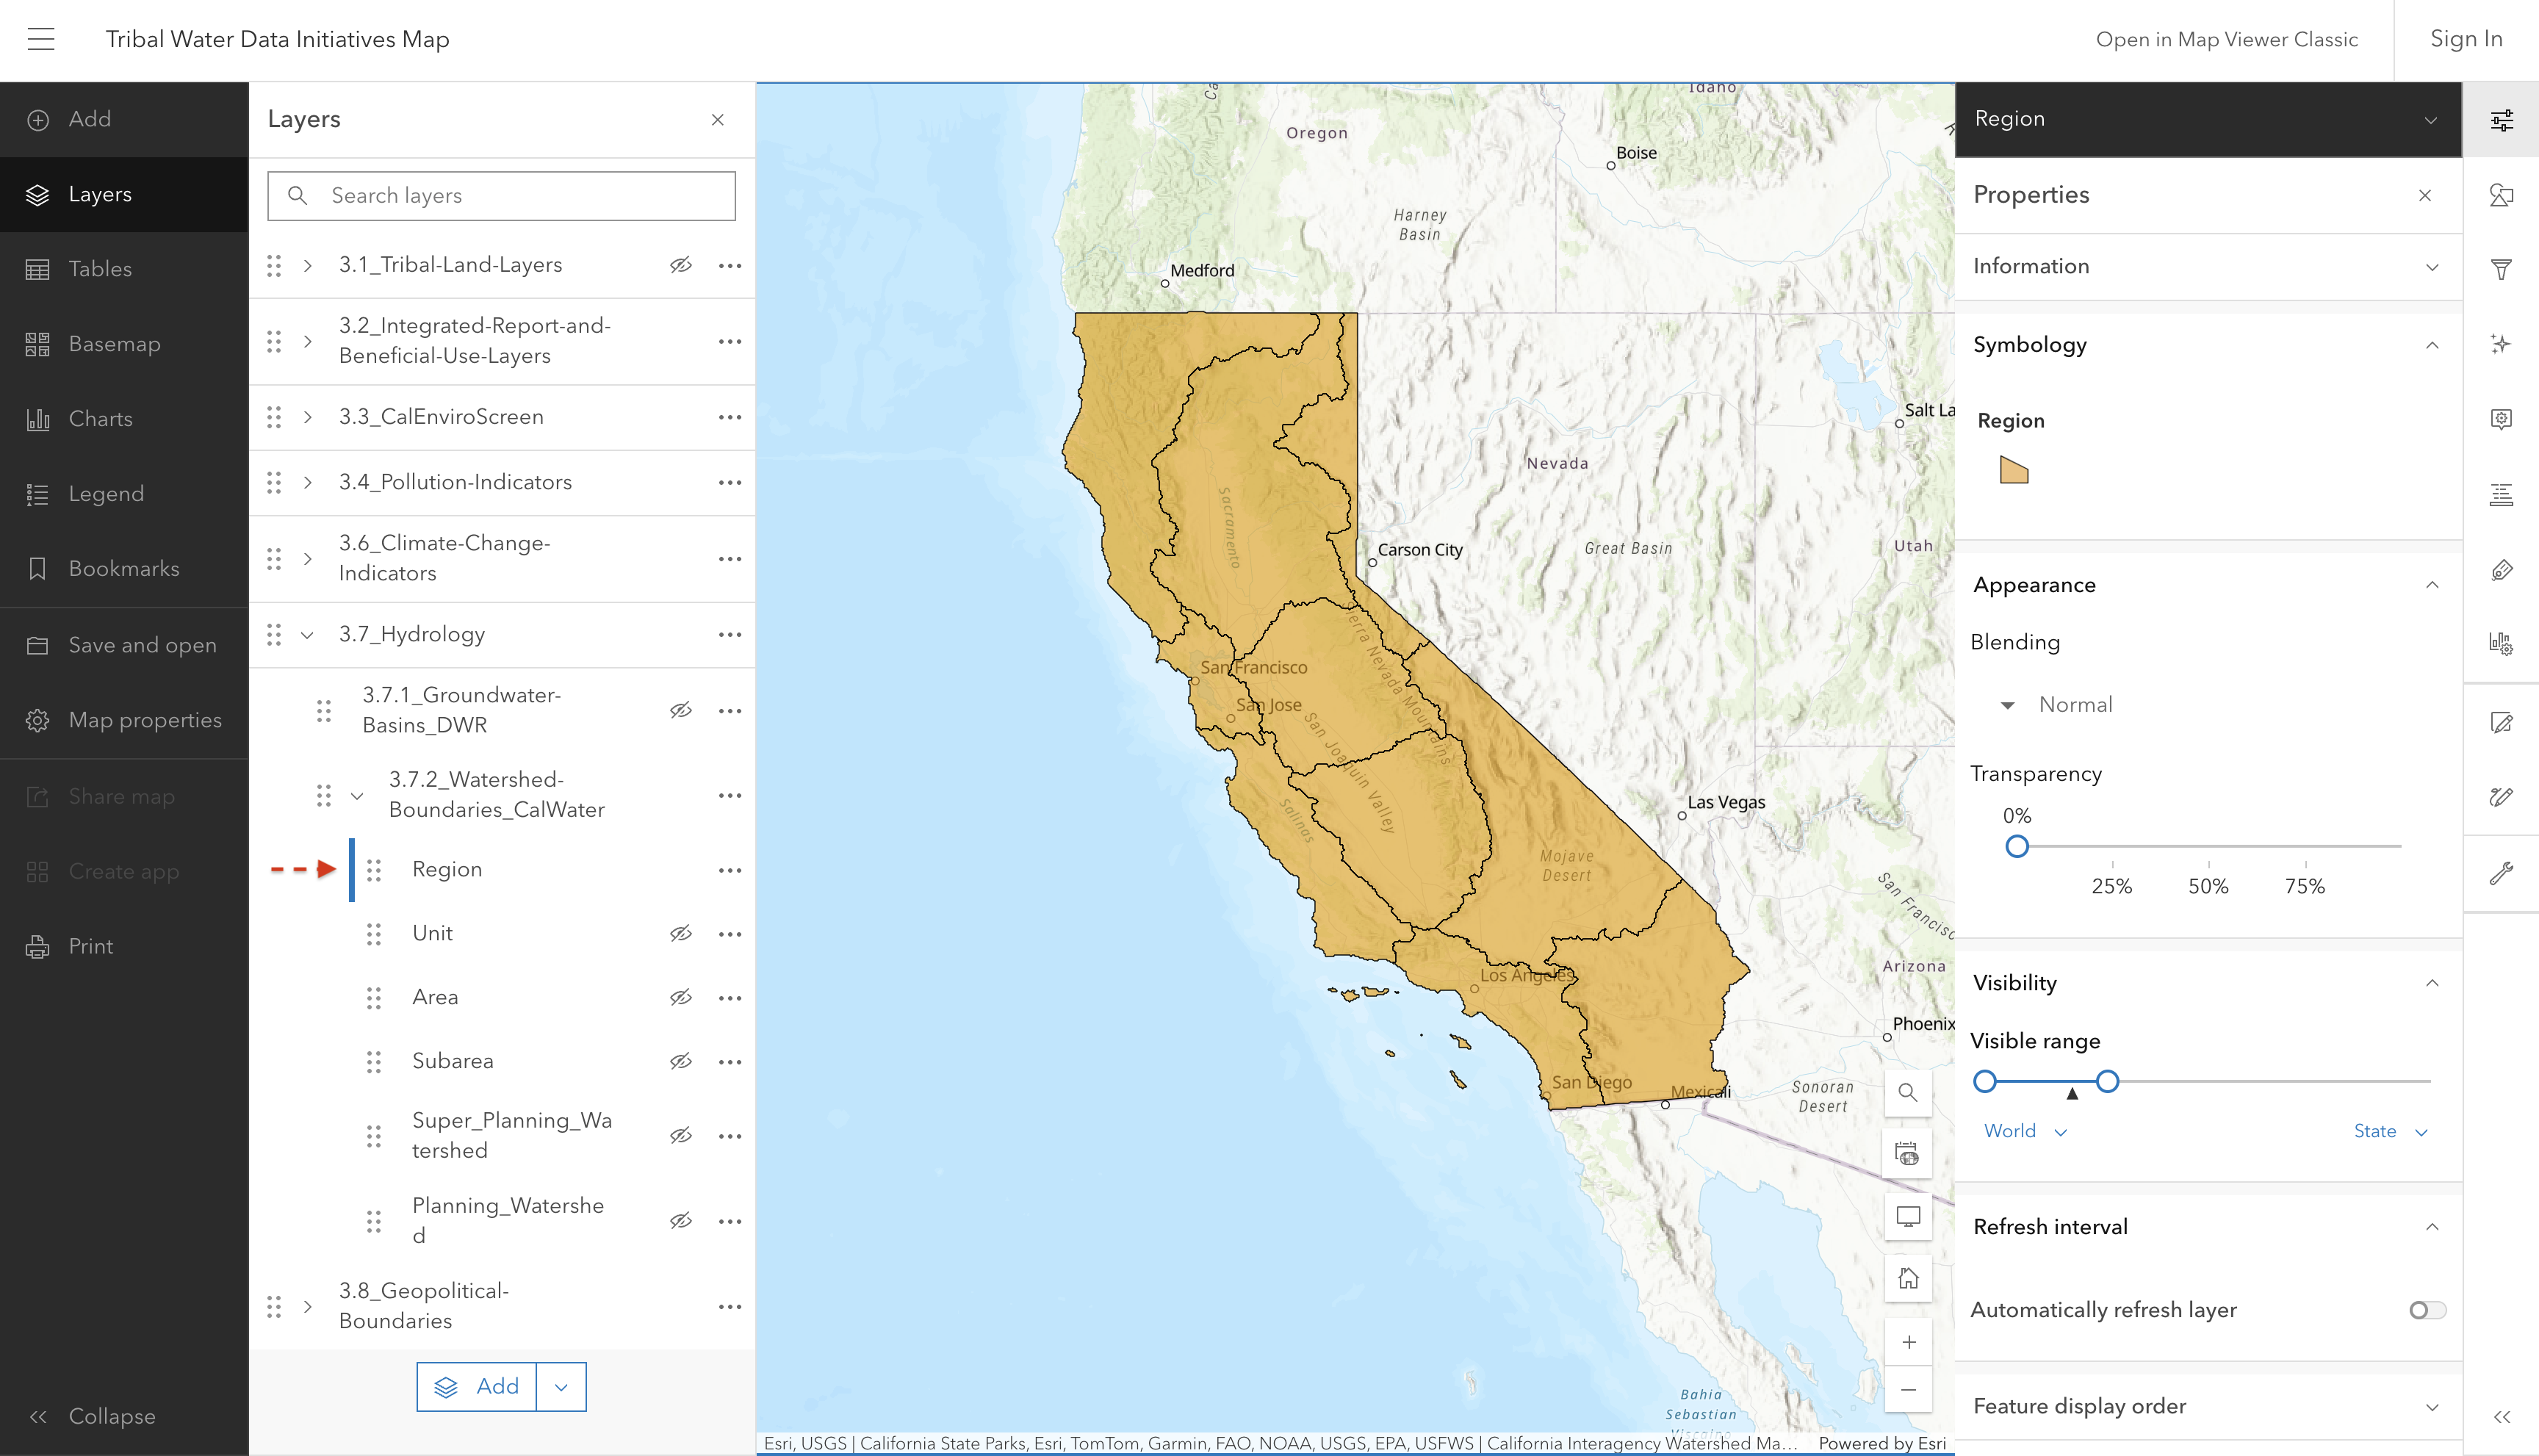
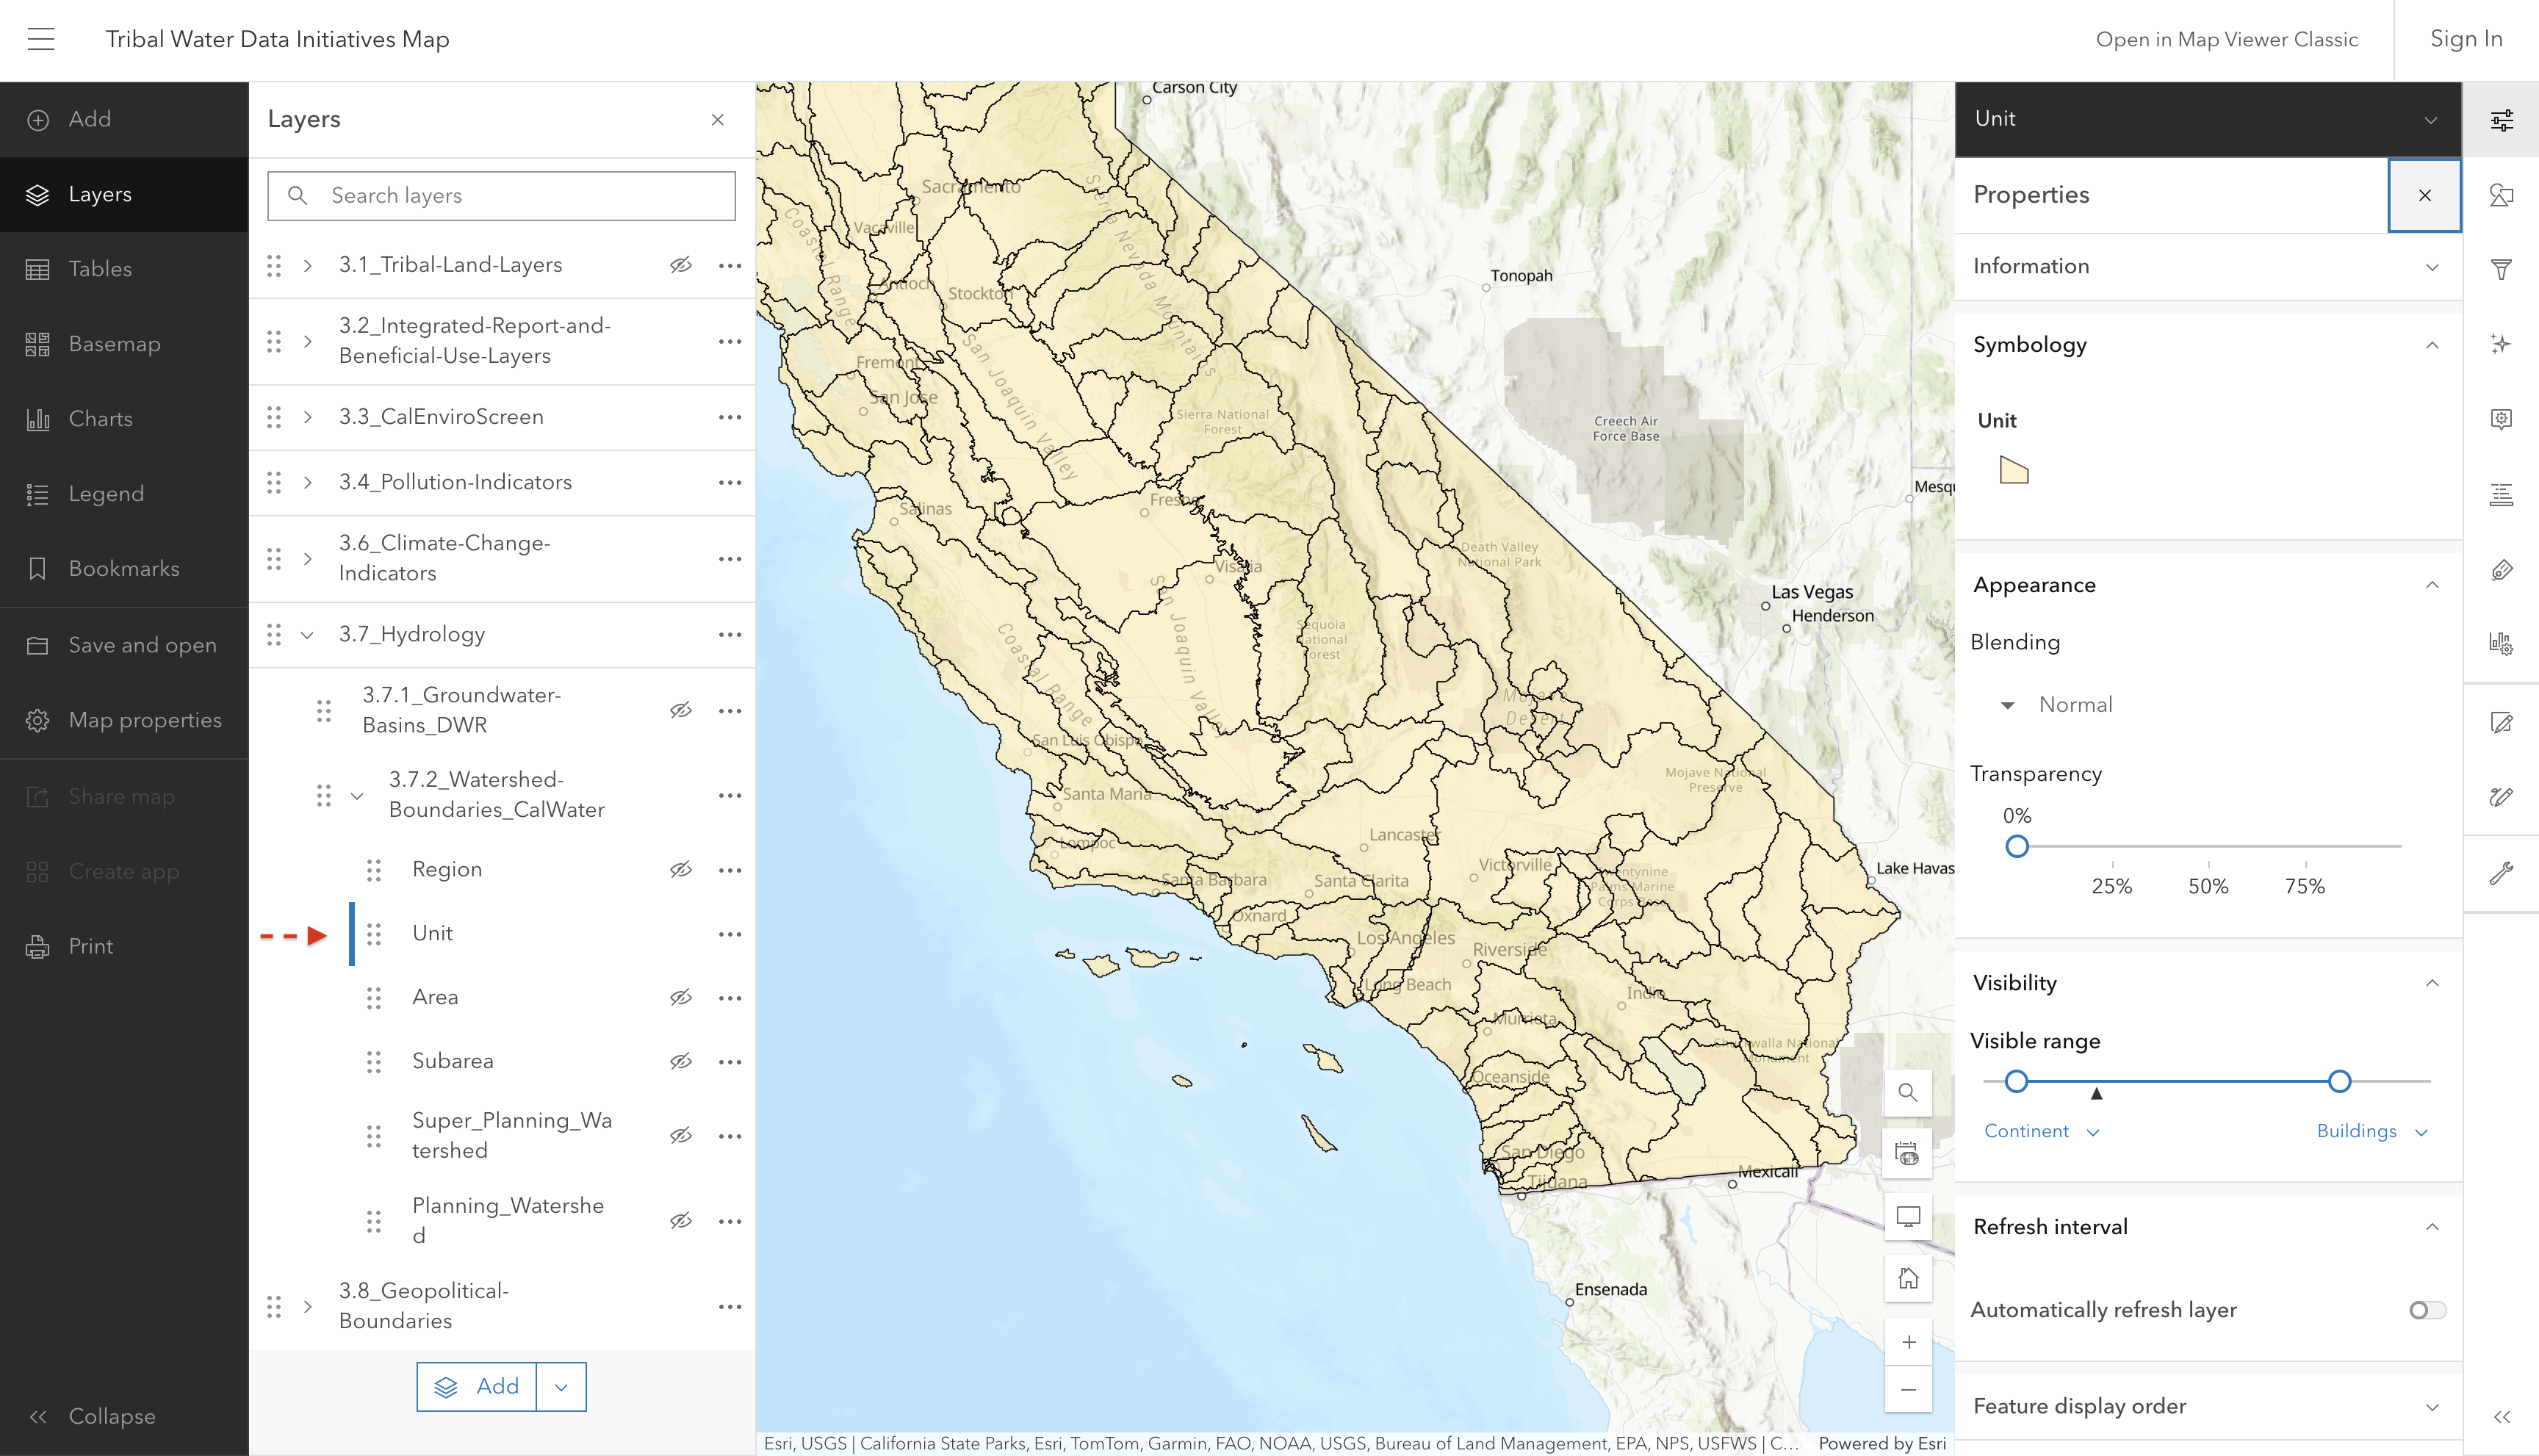
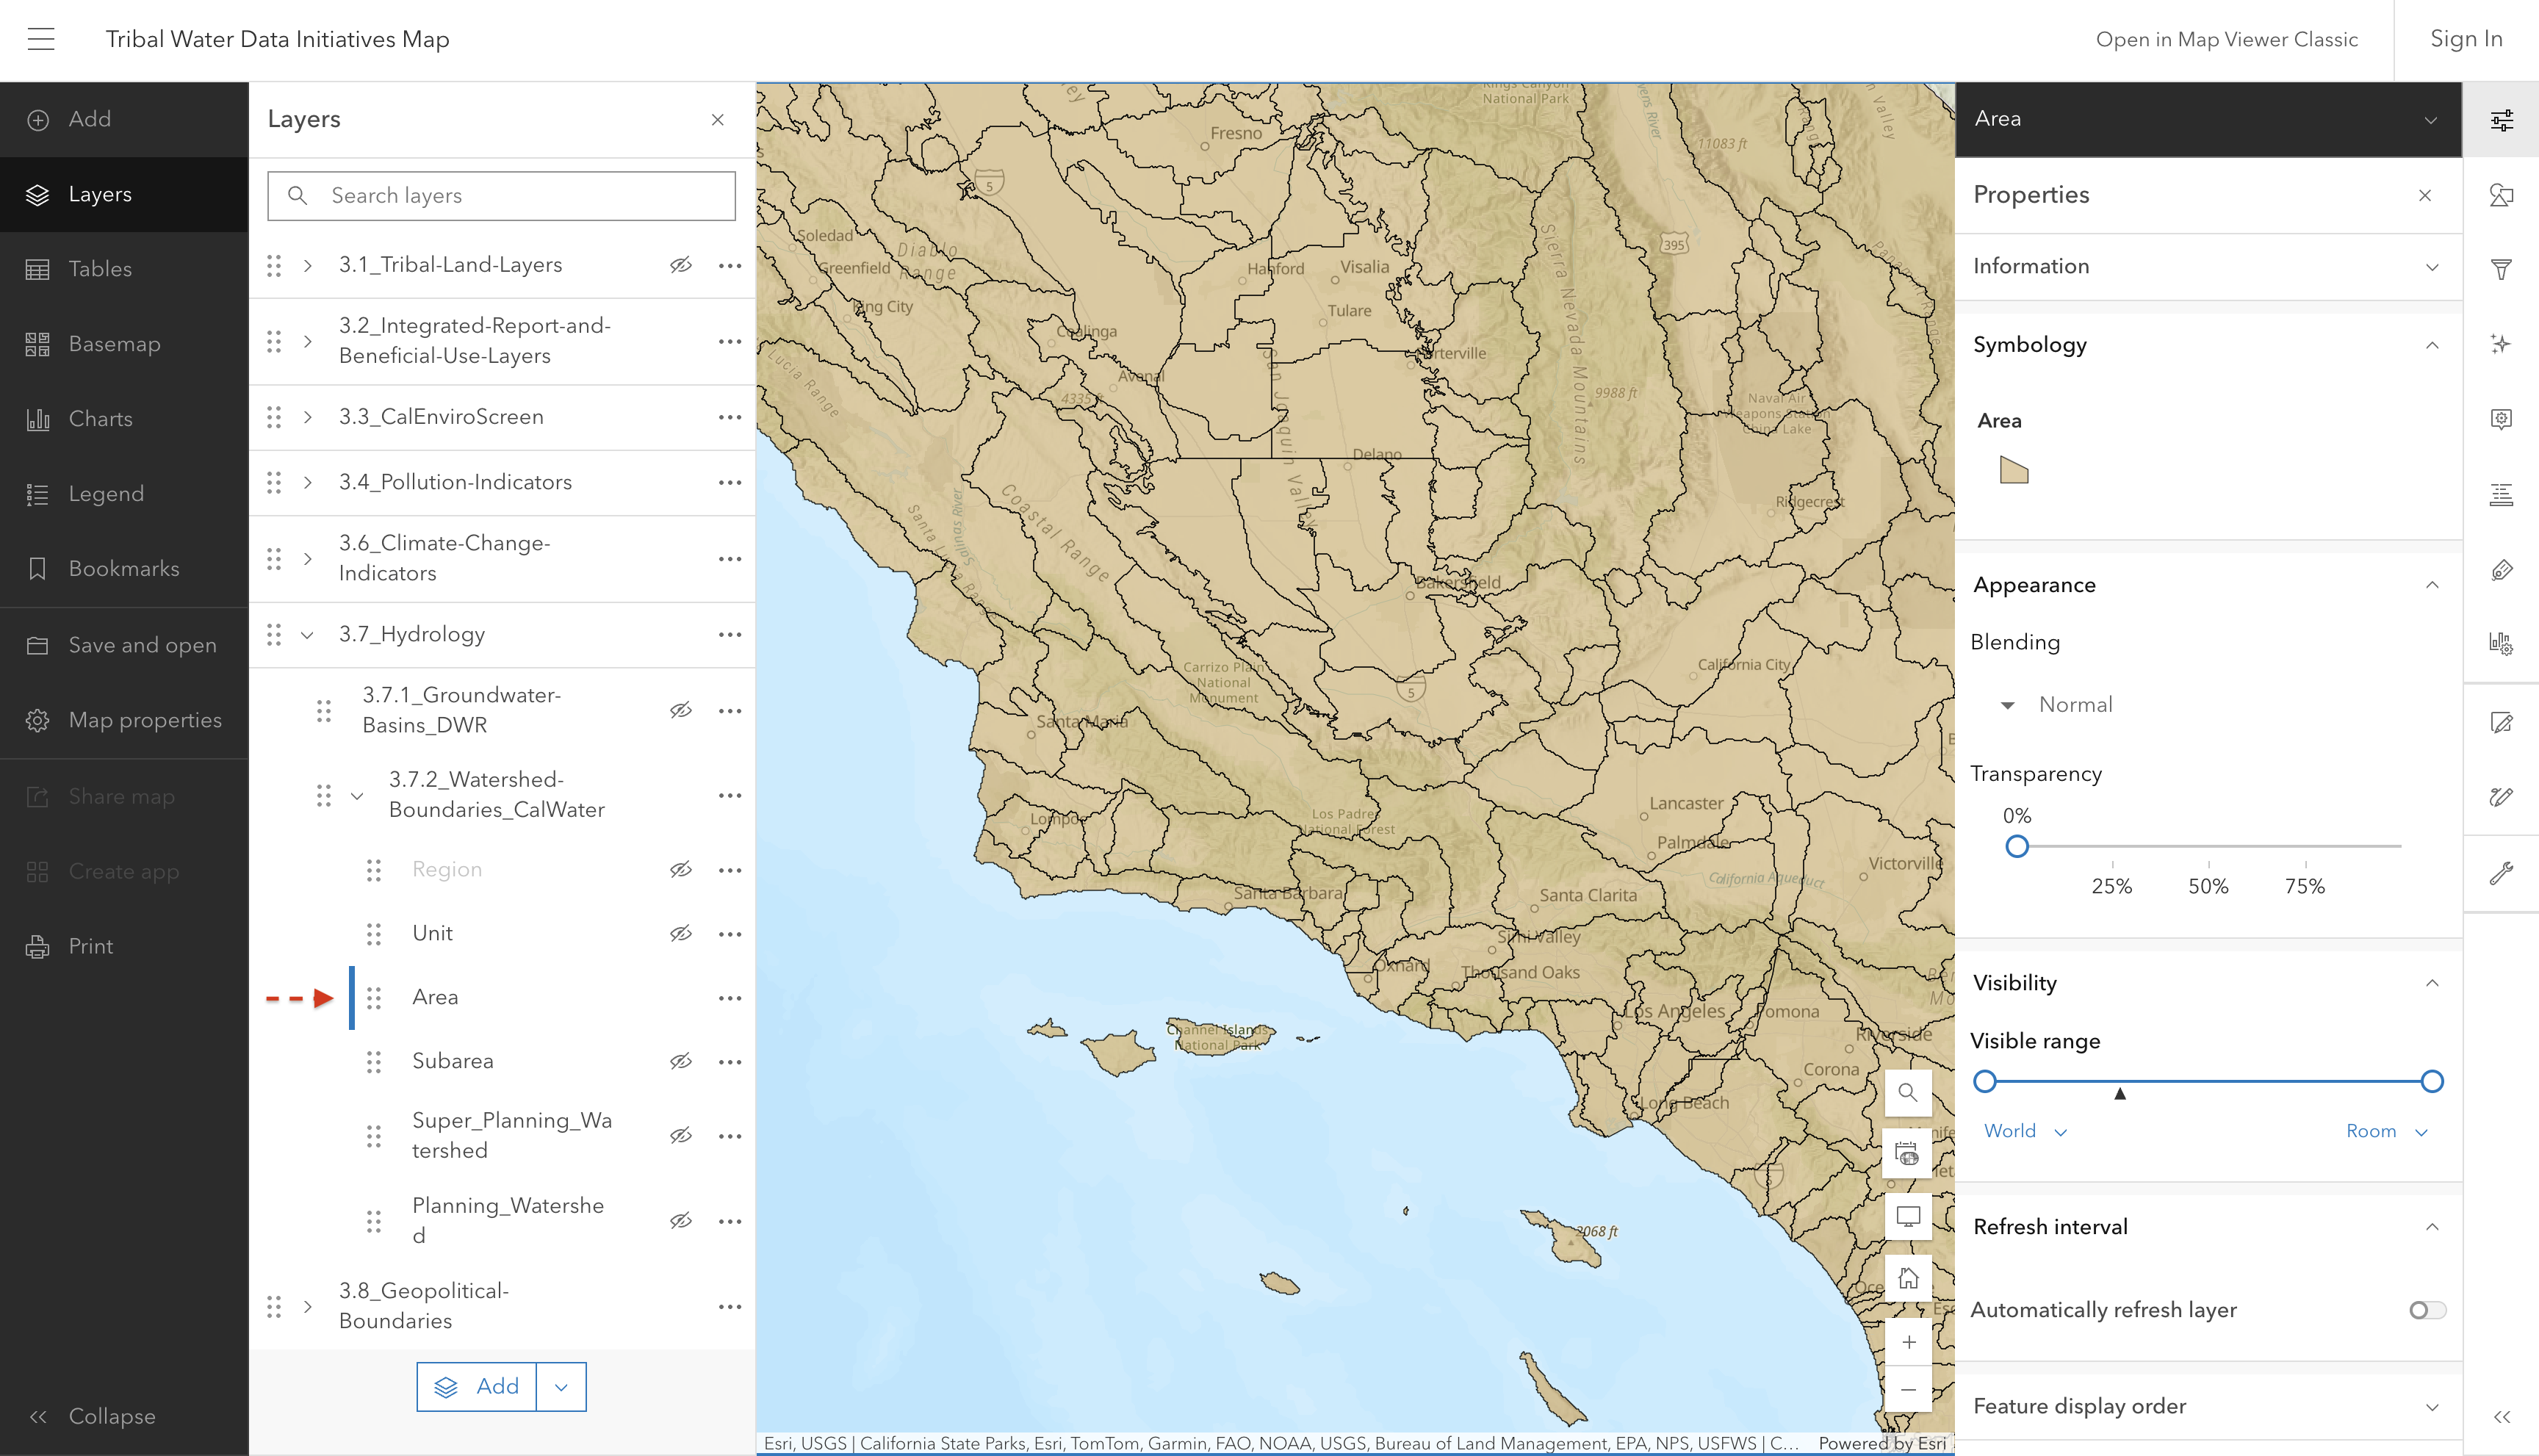
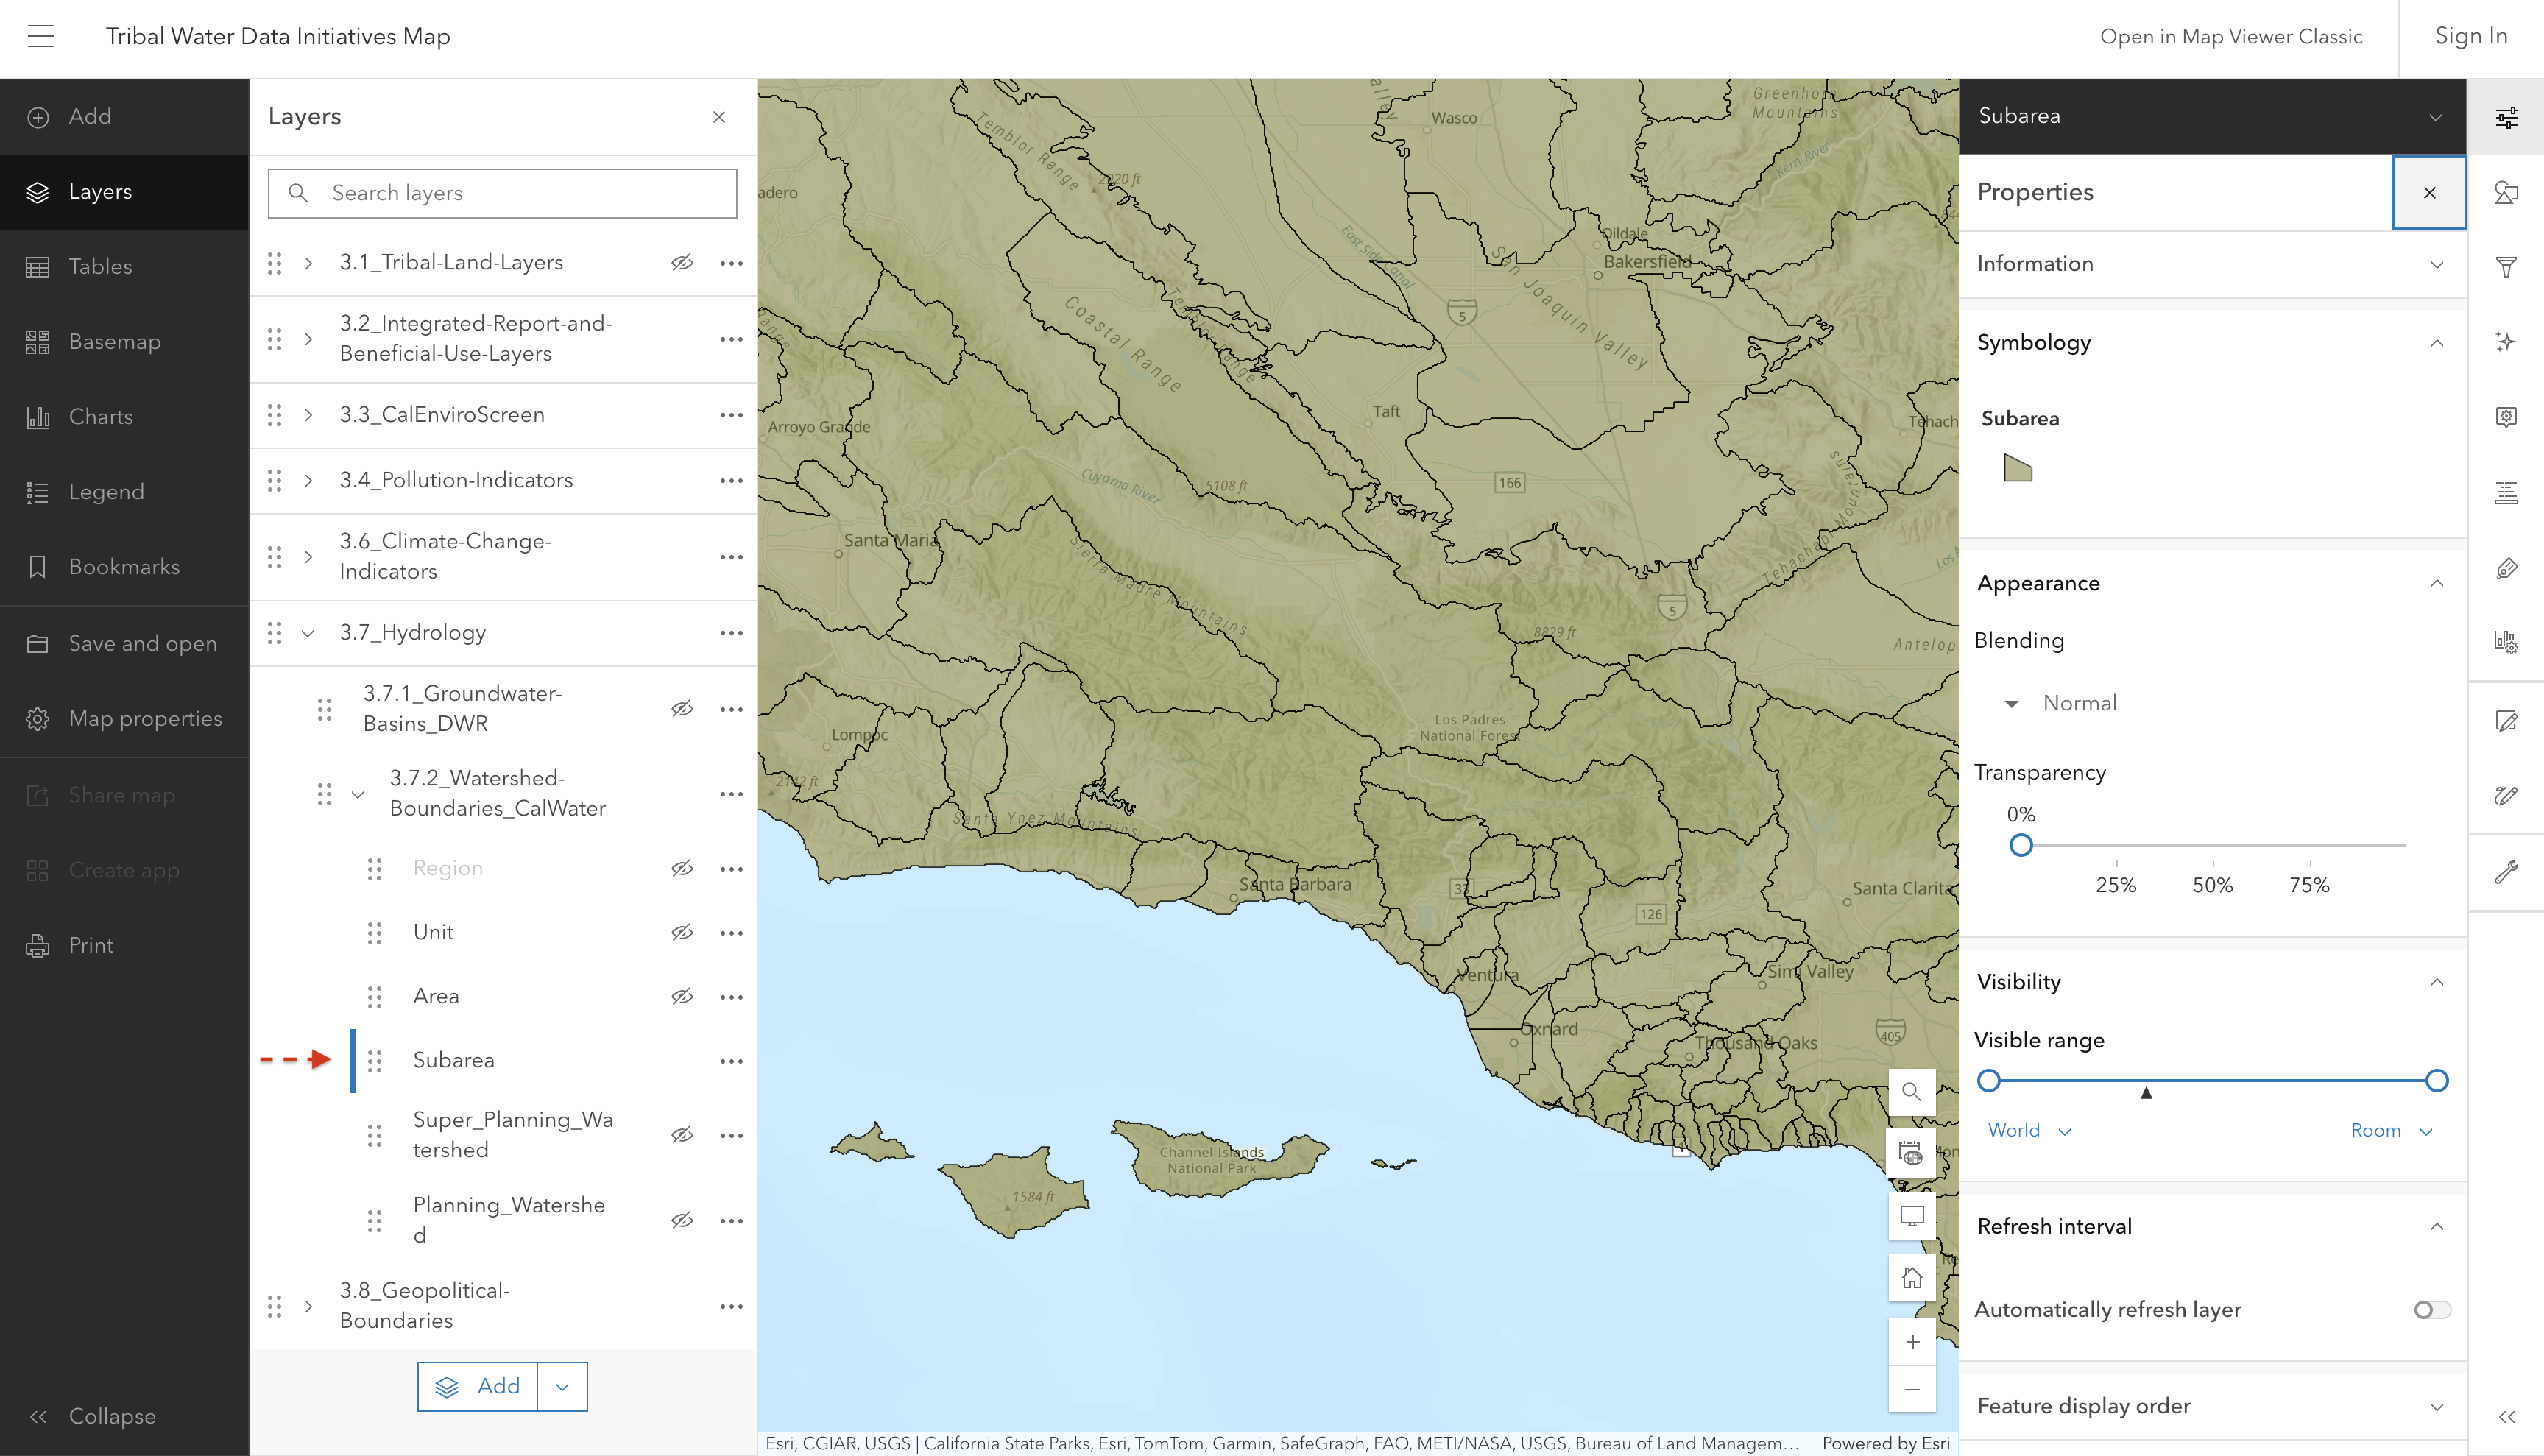
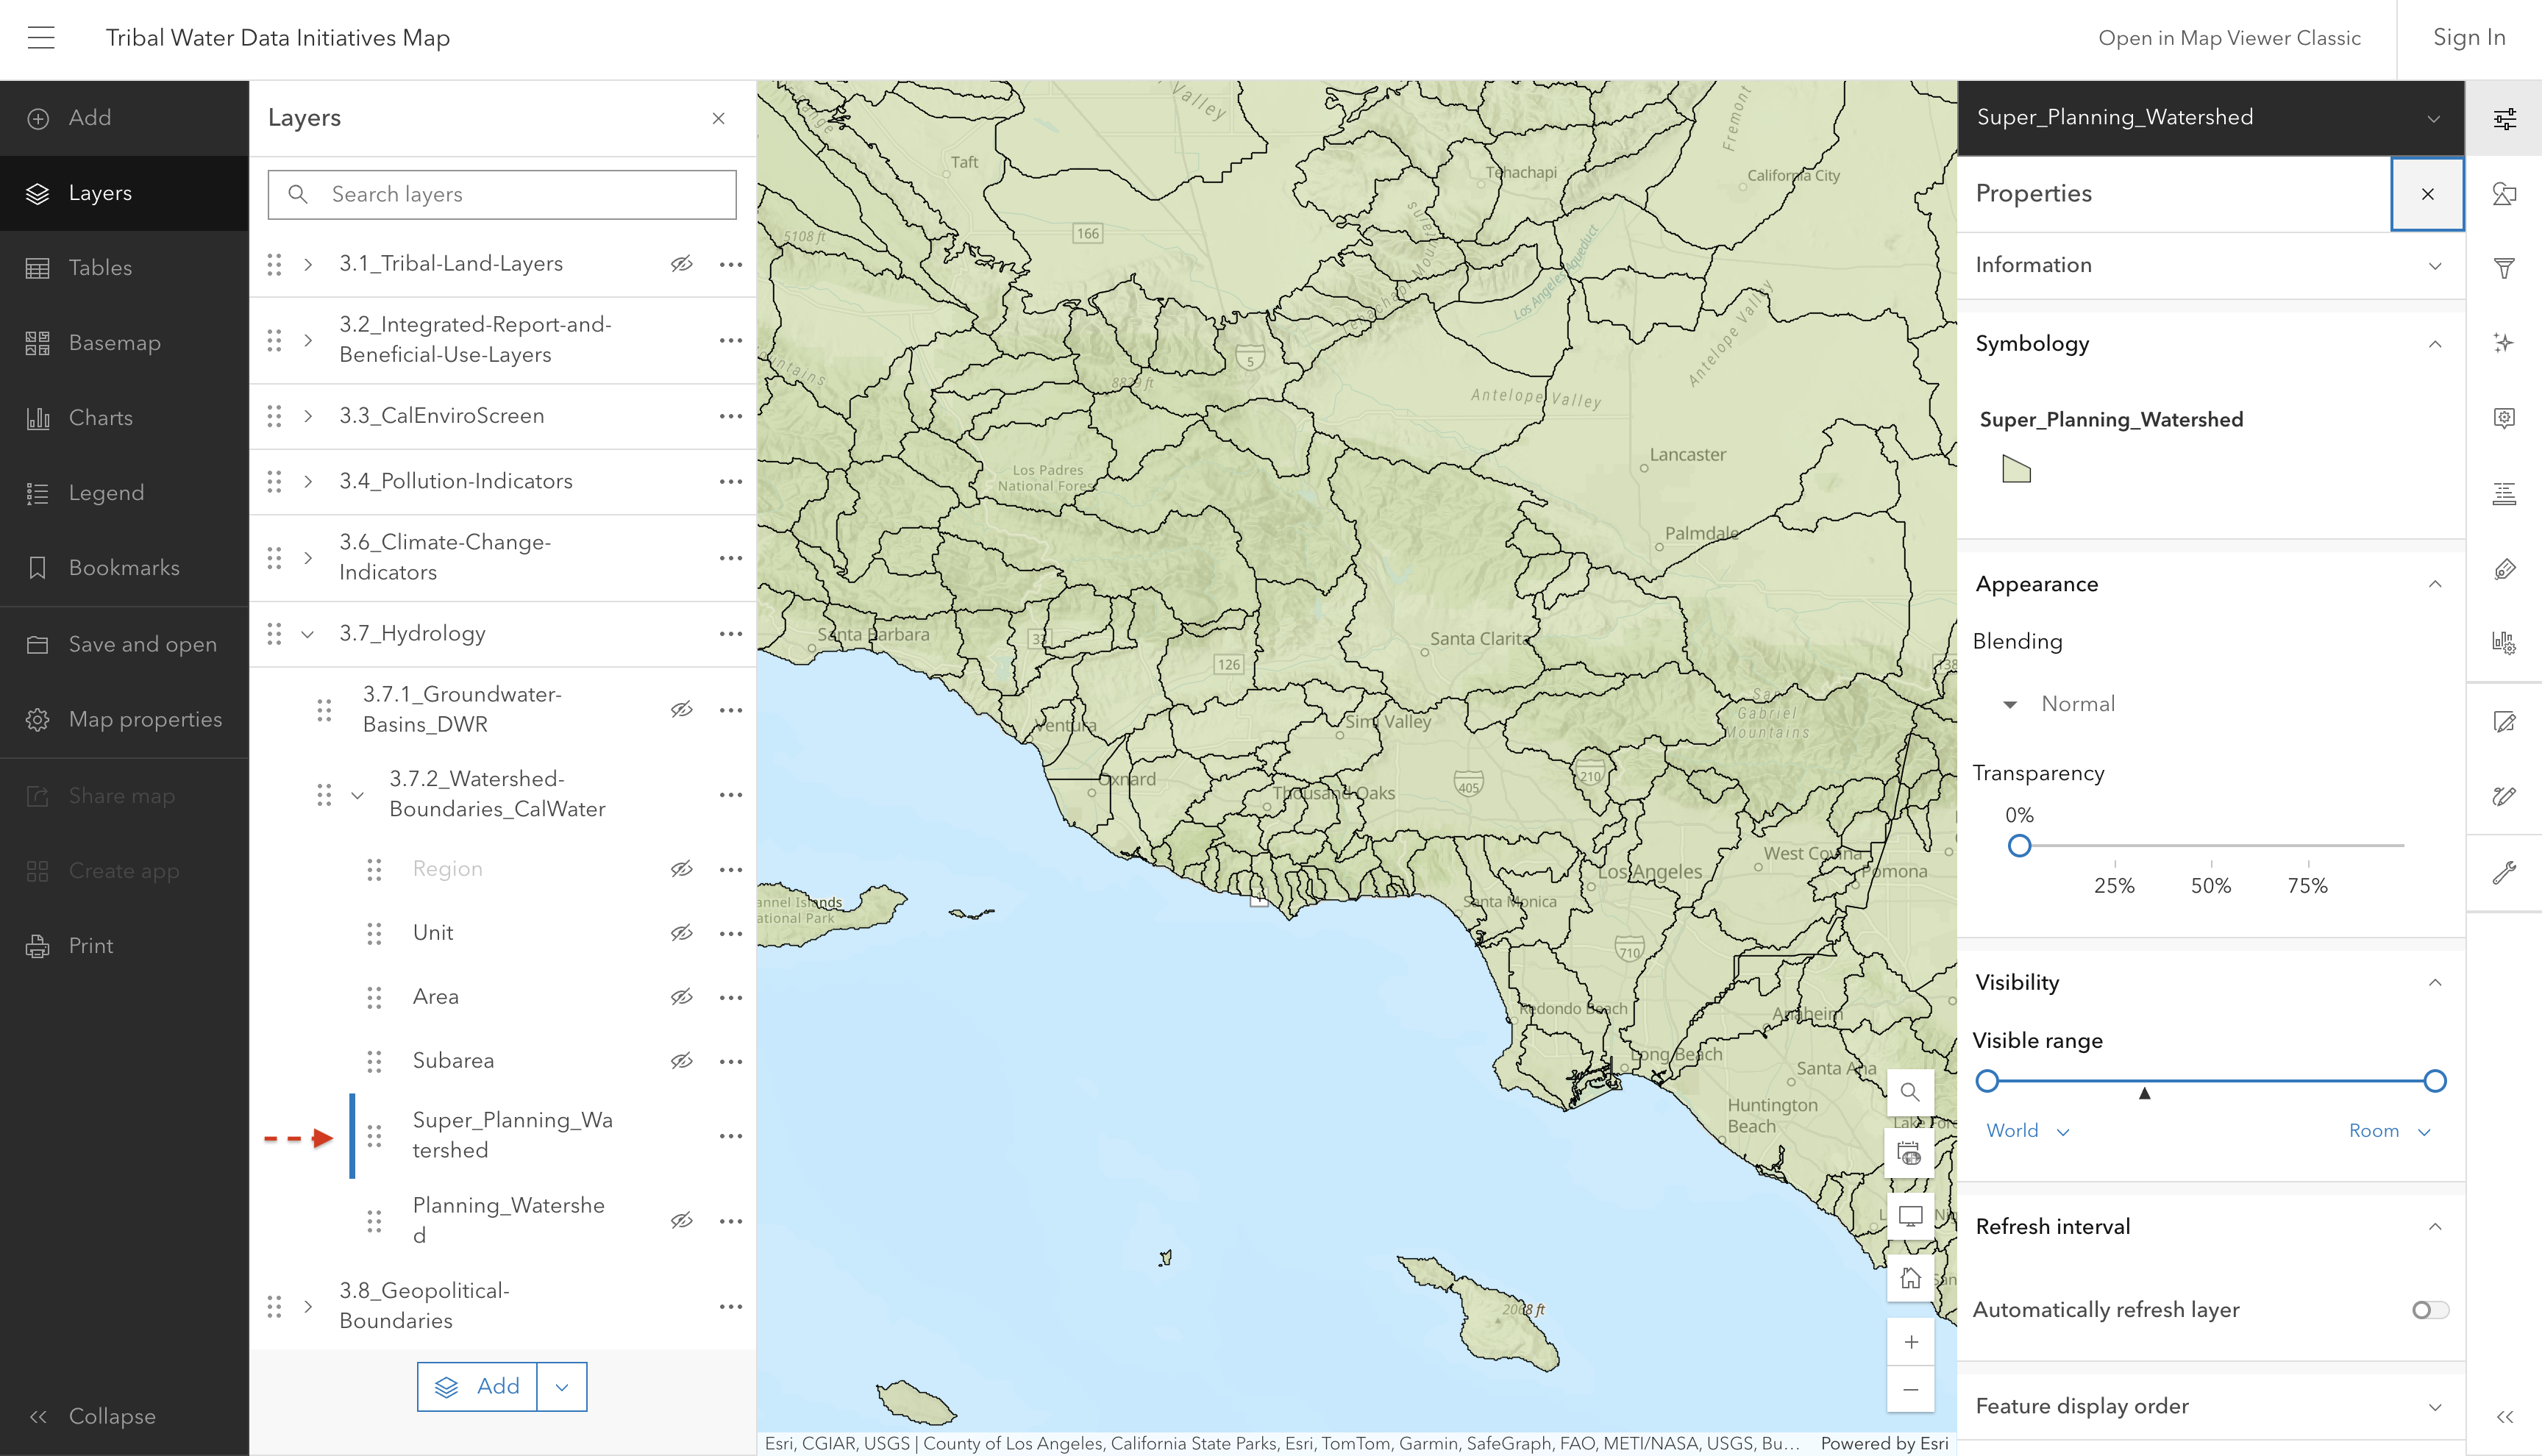
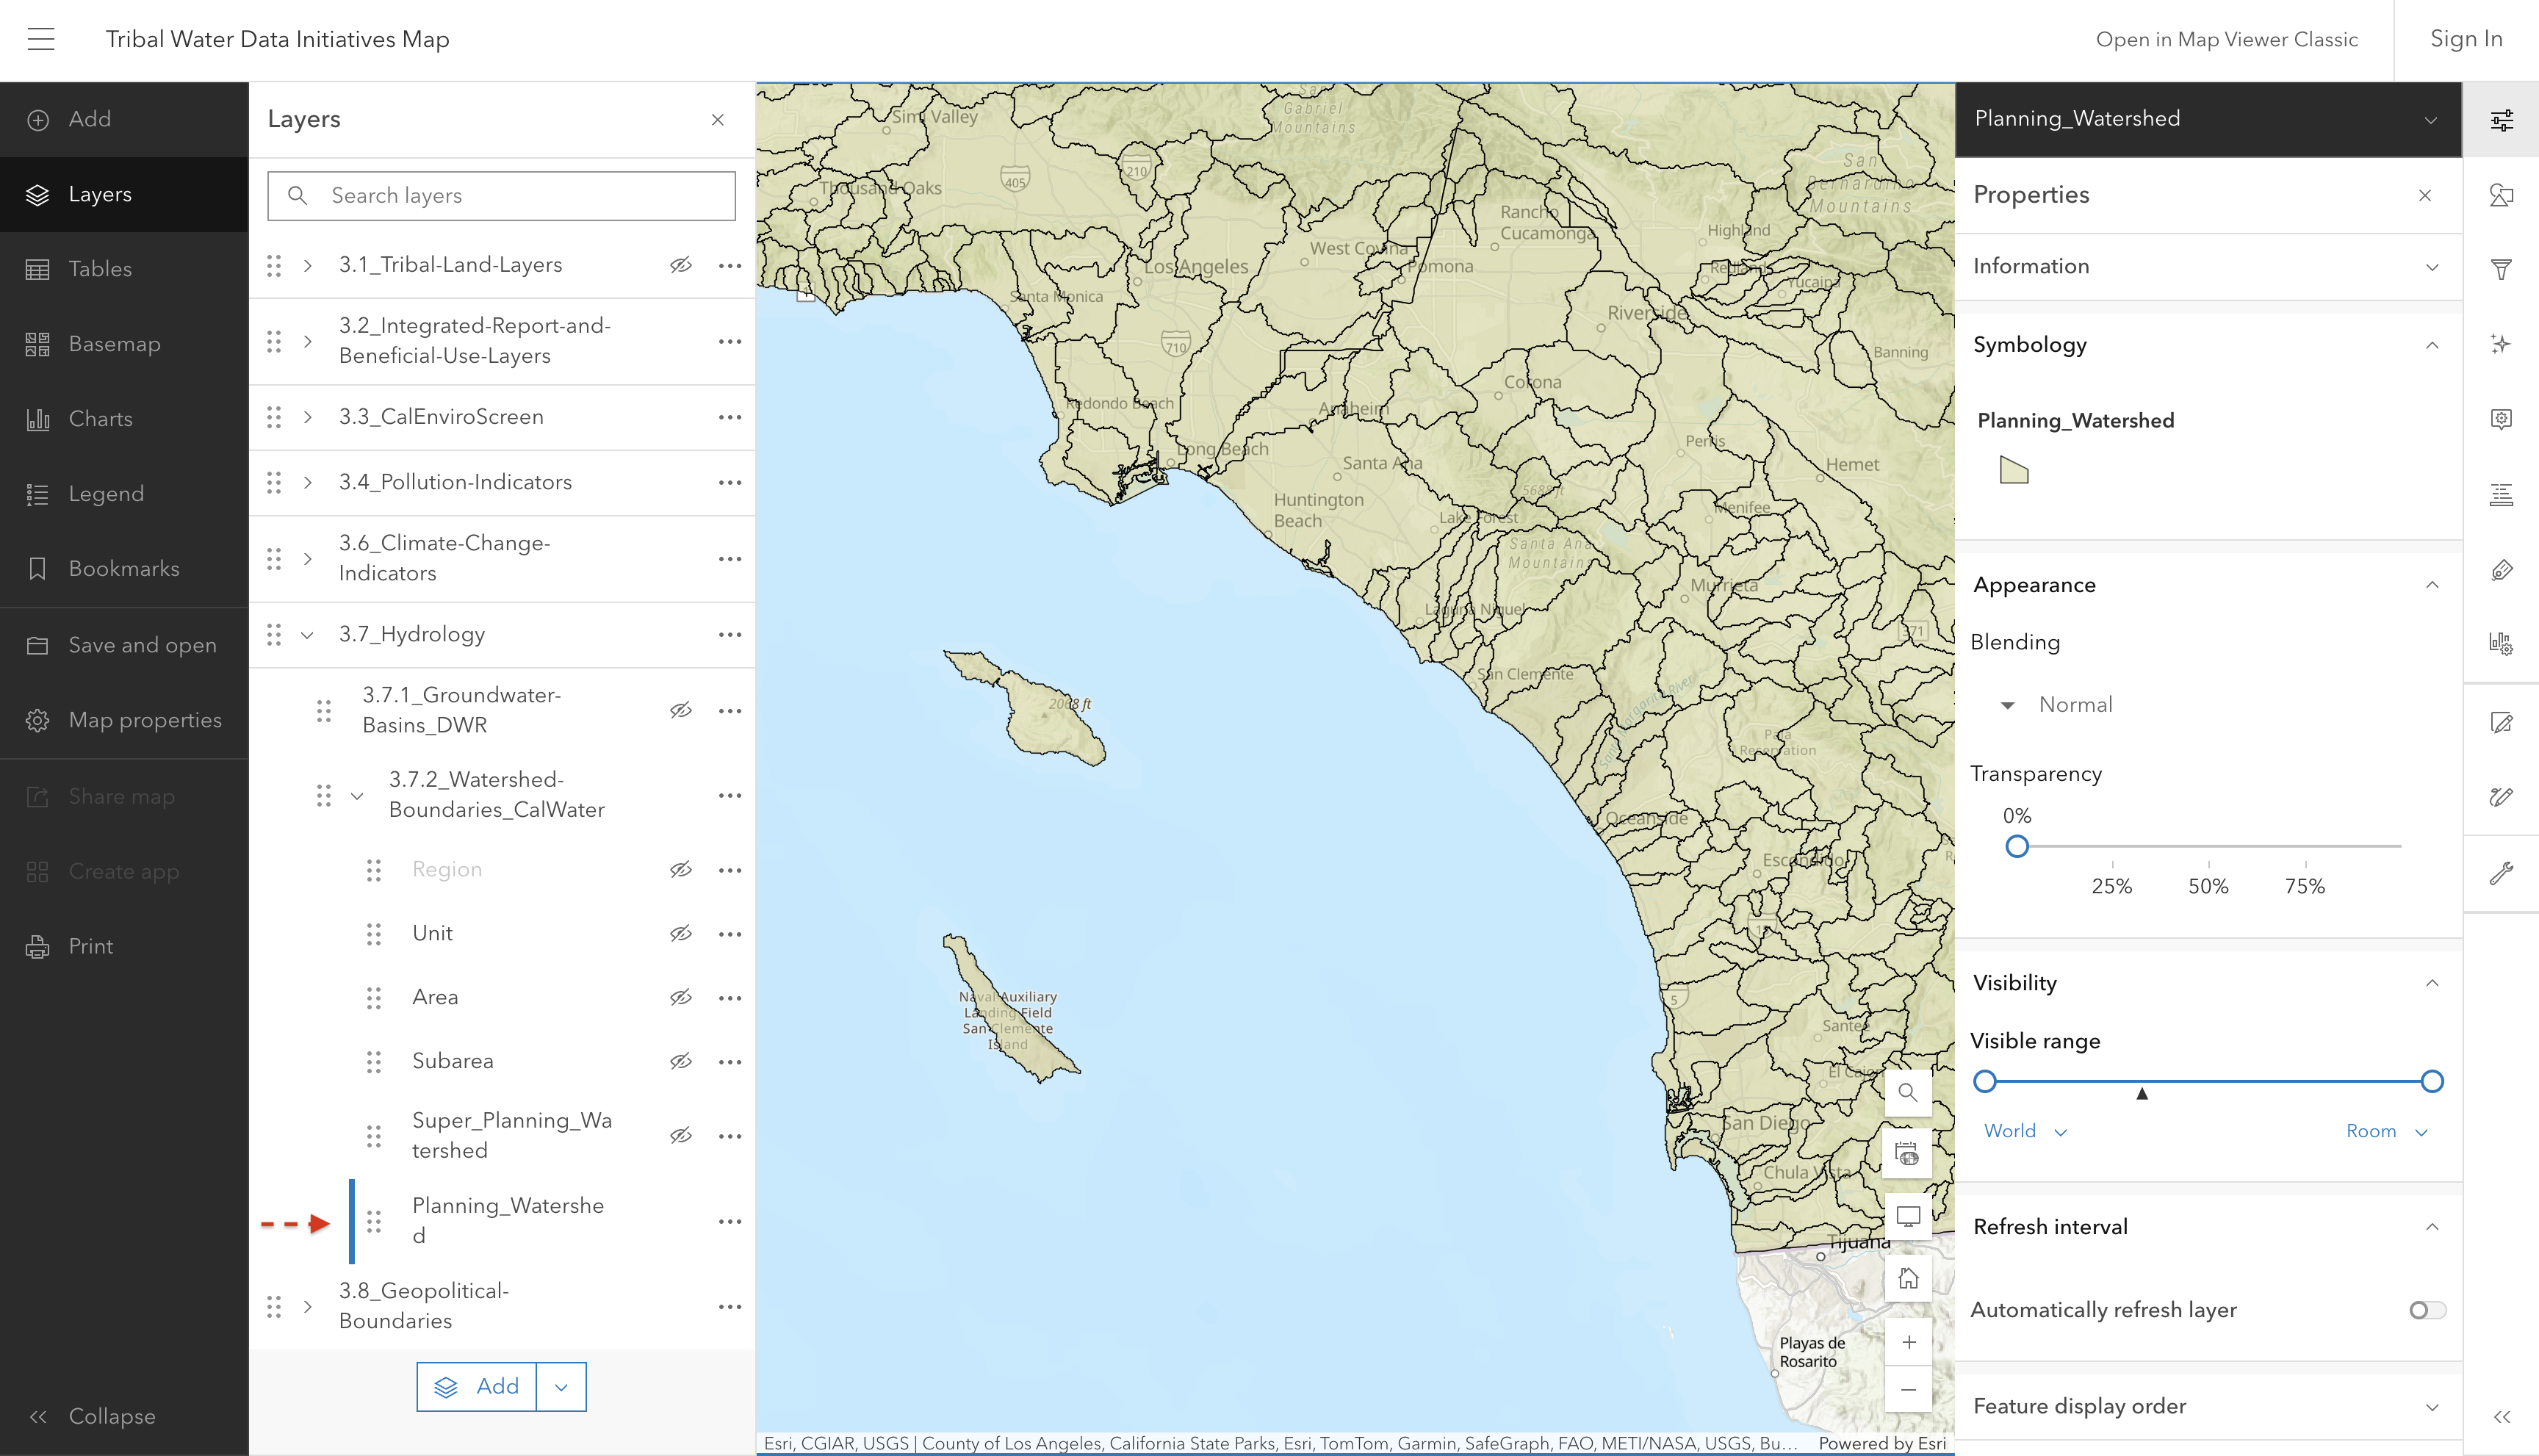
The California Interagency Watershed Map is the State of California’s working definition of watershed boundaries. Previous Calwater versions described California watersheds, beginning with the division of the State’s 101 million acres into ten Hydrologic Regions (HR). Each HR is progressively subdivided into six smaller, nested levels: the Hydrologic Unit (HU, major rivers), Hydrologic Area (HA, major tributaries), Hydrologic Sub-Area (HSA), Super Planning Watershed (SPW), and Planning Watershed (PW), with the Planning Watershed as the most detailed level. See metadata for more information.

Screenshot of interactive map showing watershed boundaries at the region level

Screenshot of interactive map showing watershed boundaries at the unit level

Screenshot of interactive map showing watershed boundaries at the area level

Screenshot of interactive map showing watershed boundaries at the subarea level

Screenshot of interactive map showing watershed boundaries at the super planning level

Screenshot of interactive map showing watershed boundaries at the planning level

Source: CalWater Watersheds - Overview

Source update frequency: As needed

automatically synced here

Contact: California Interagency Watershed Mapping Group is a committee comprised of several state agencies. For questions, please contact the State Water Resources Control Board

3.8 Geopolitical Boundaries

3.8.1 Regional Water Board Boundaries

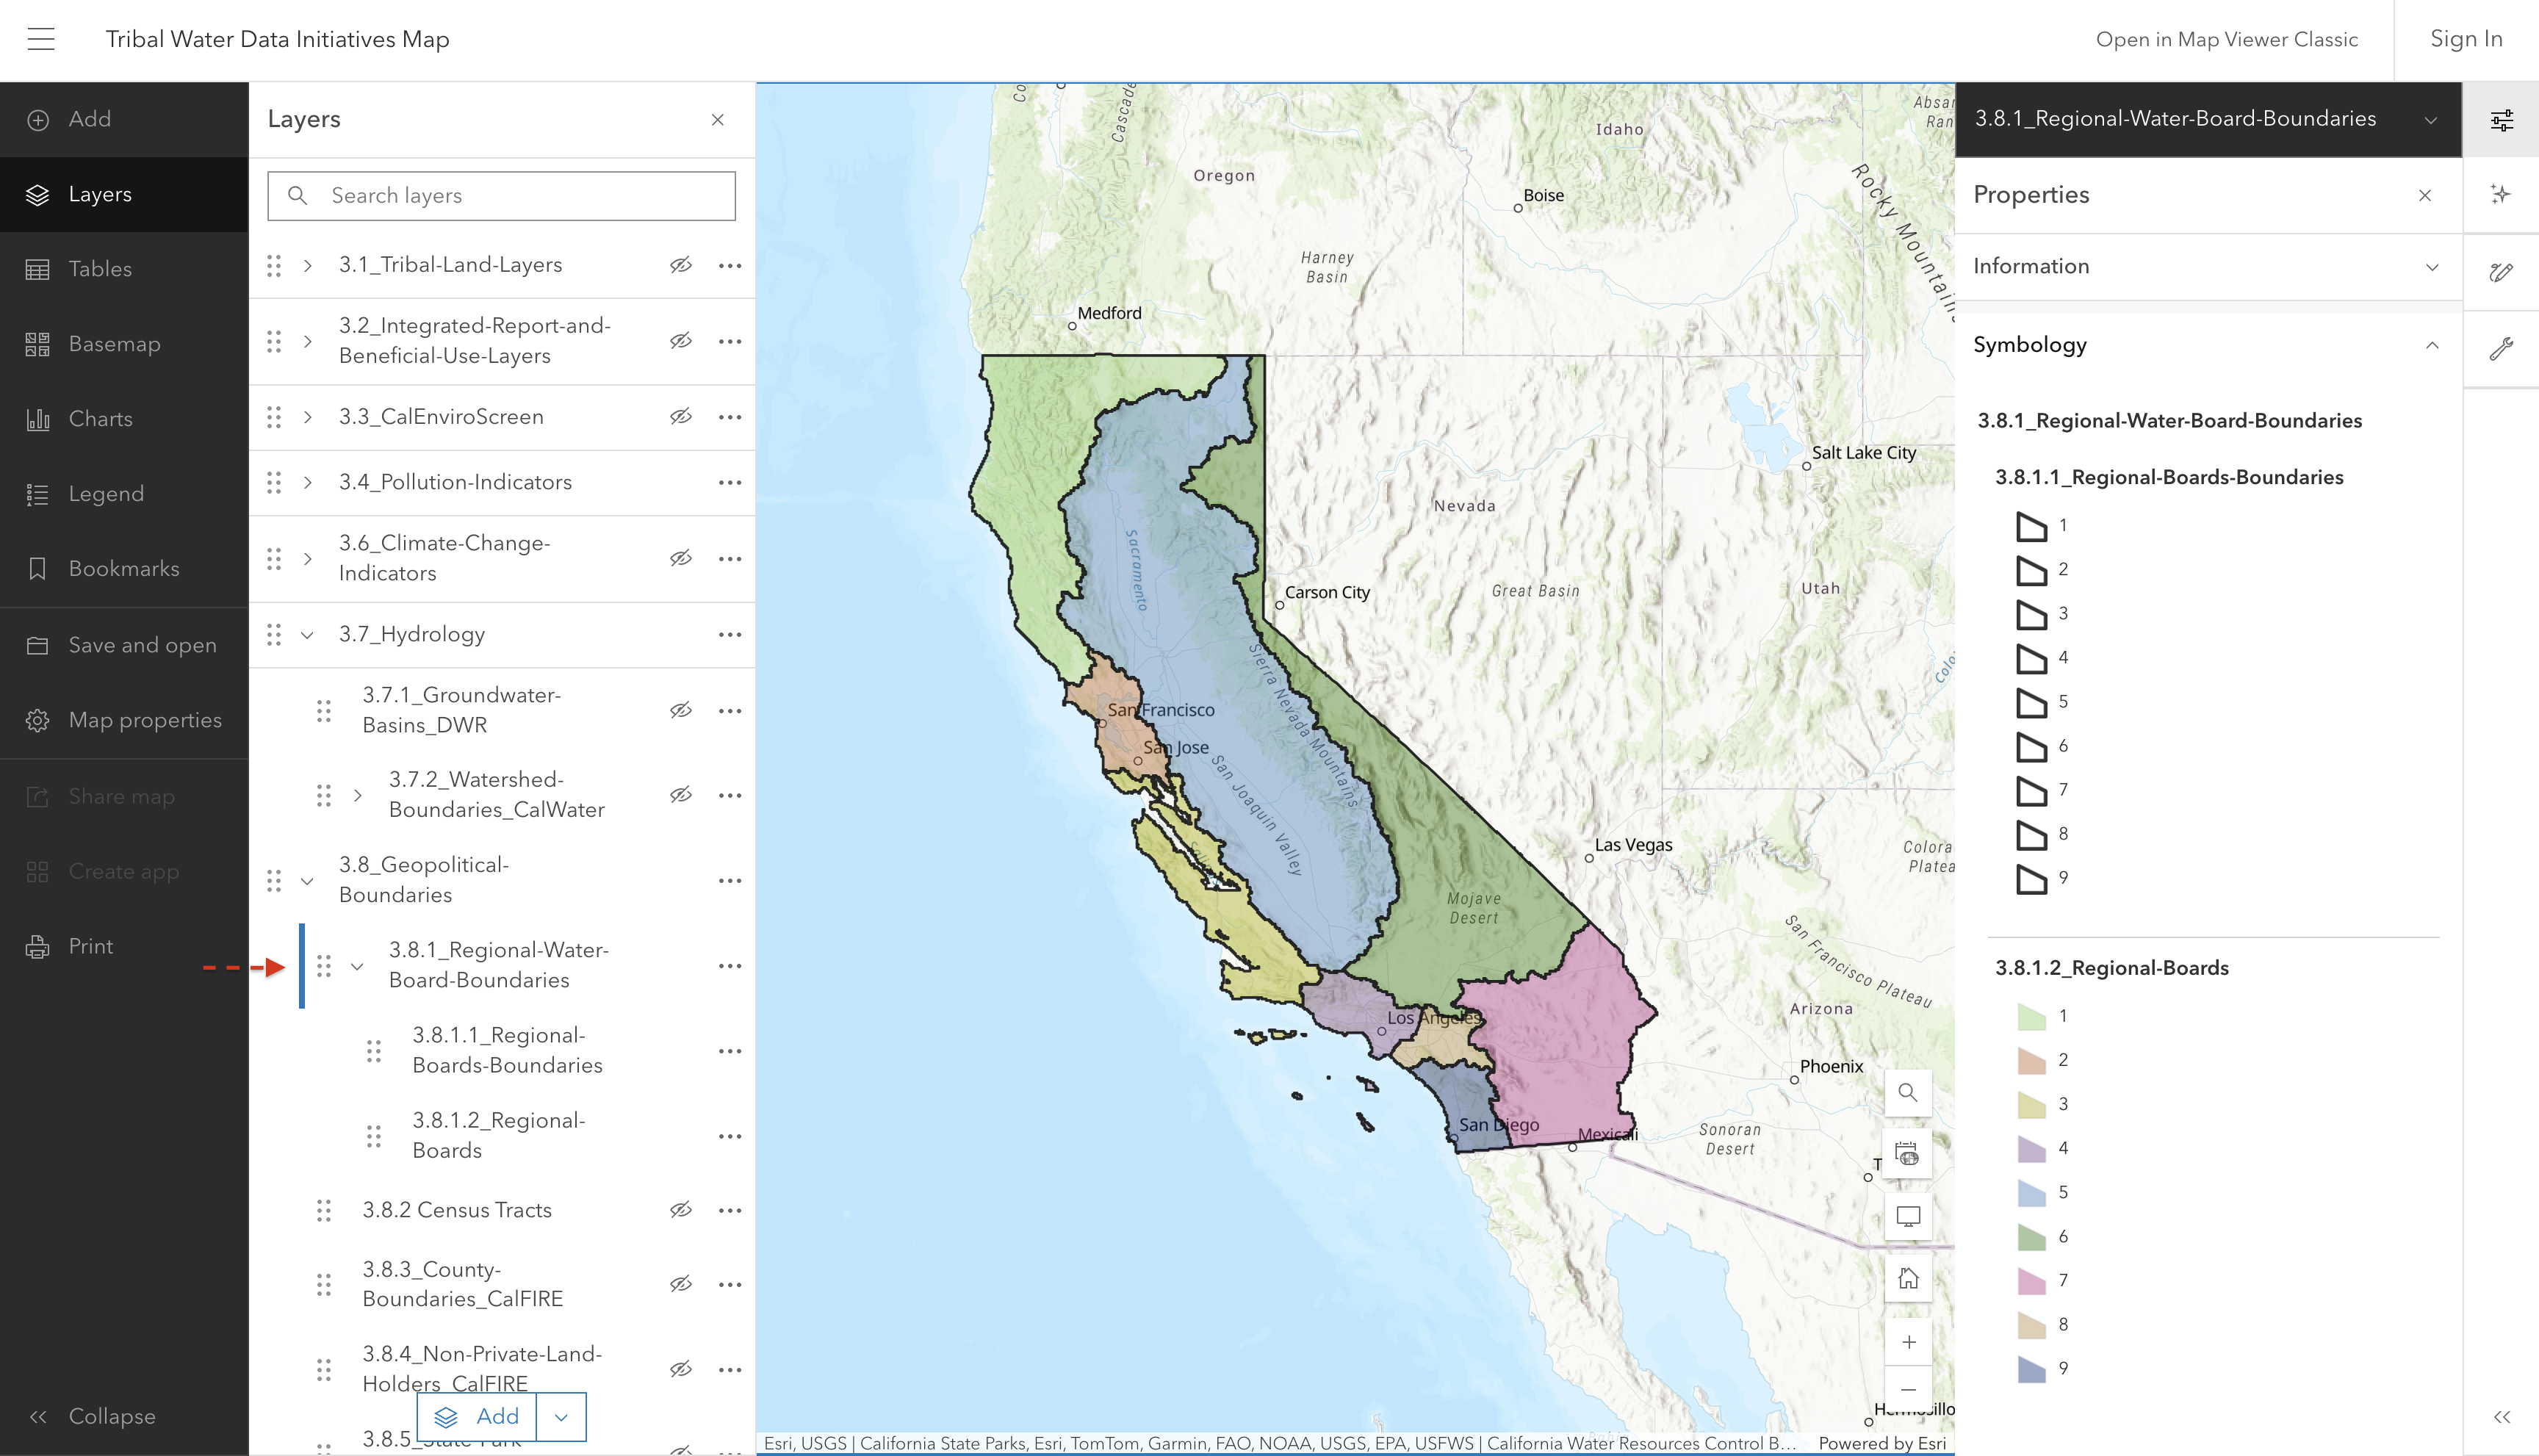
Layer showing the boundaries of the nine Regional Water Quality Control Boards in California.

Screenshot of interactive map showing Regional Water Board Boundaries

Source: California State Water Resources Control Board (SWRCB)

Source update frequency: As needed

automatically synced here

Contact: CA State Water Resources Control Board

3.8.2 Census Tracts

3.8.3 County Boundaries

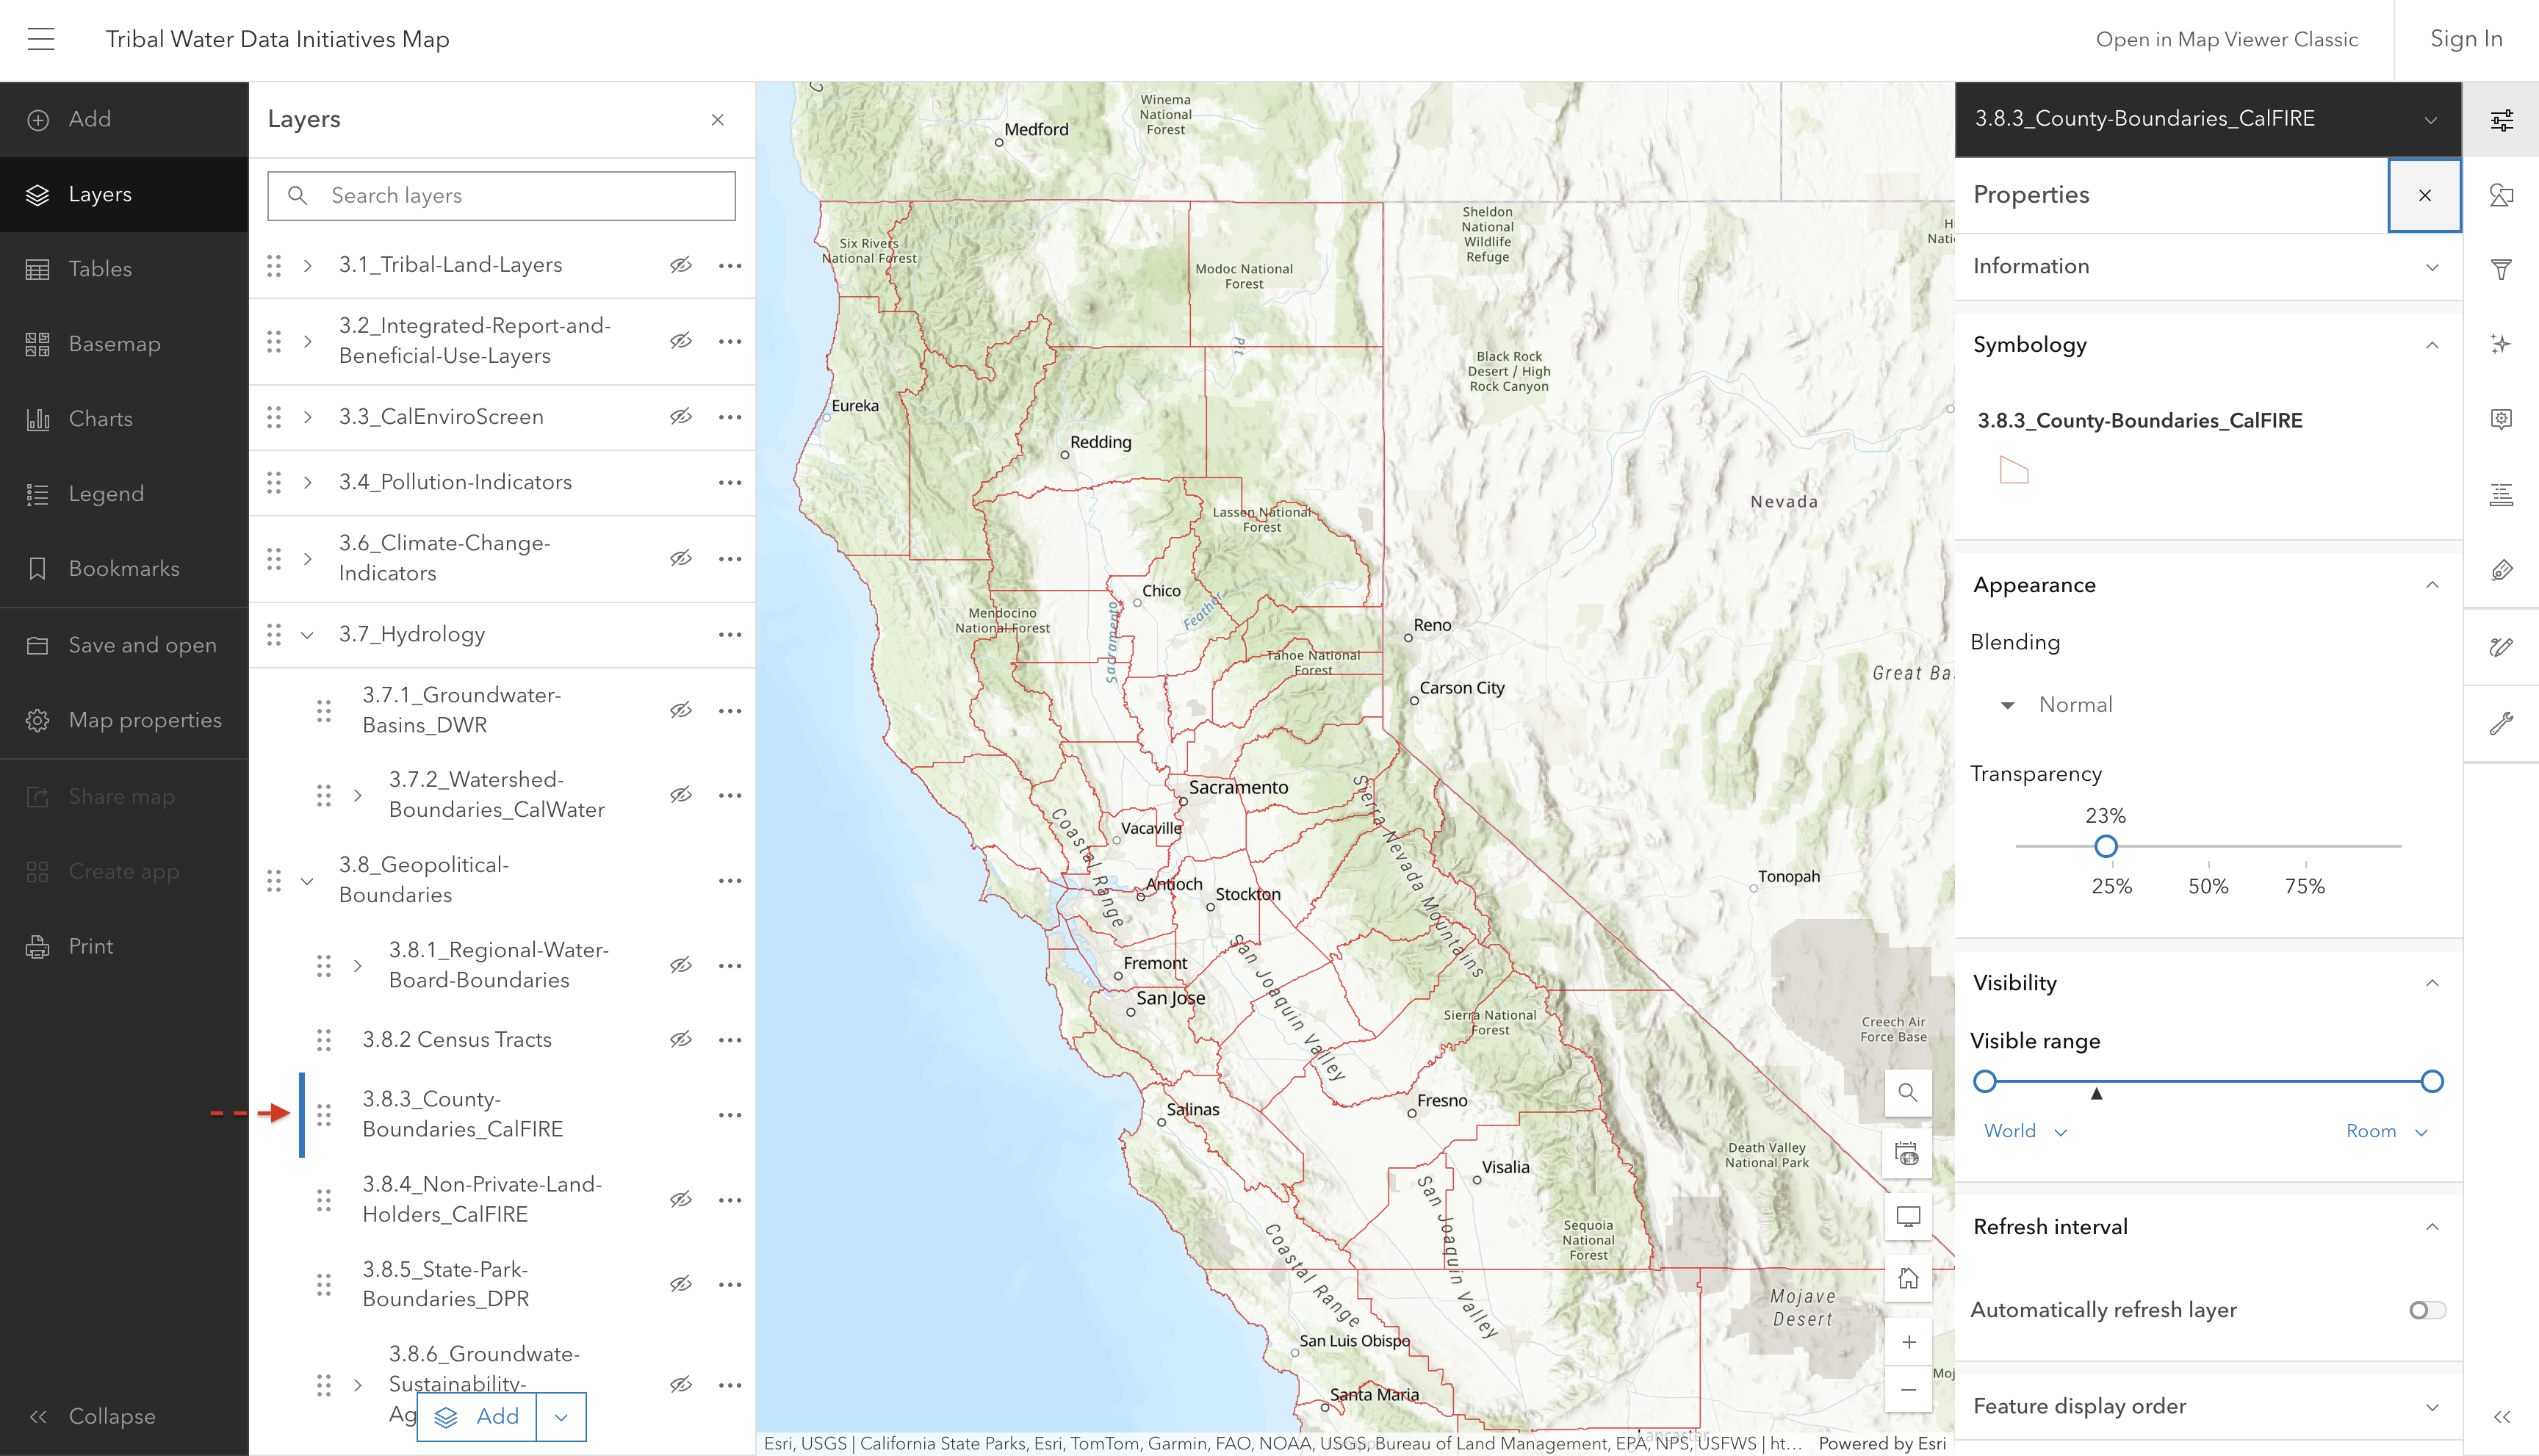
This layer shows County boundaries within California.

Screenshot of interactive map showing California county boundaries

In this dataset, all bays (plus bay islands and constructed features) are merged into the mainland, and coastal features (such as islands and constructed features) are not included, with the exception of the Channel Islands which ARE included.

Source: California Dept. of Forestry and Fire Protection (CalFIRE)

Source update frequency: As needed

automatically synced here

Contact: CAL FIRE eGIS

3.8.4 Non-private Land Holders

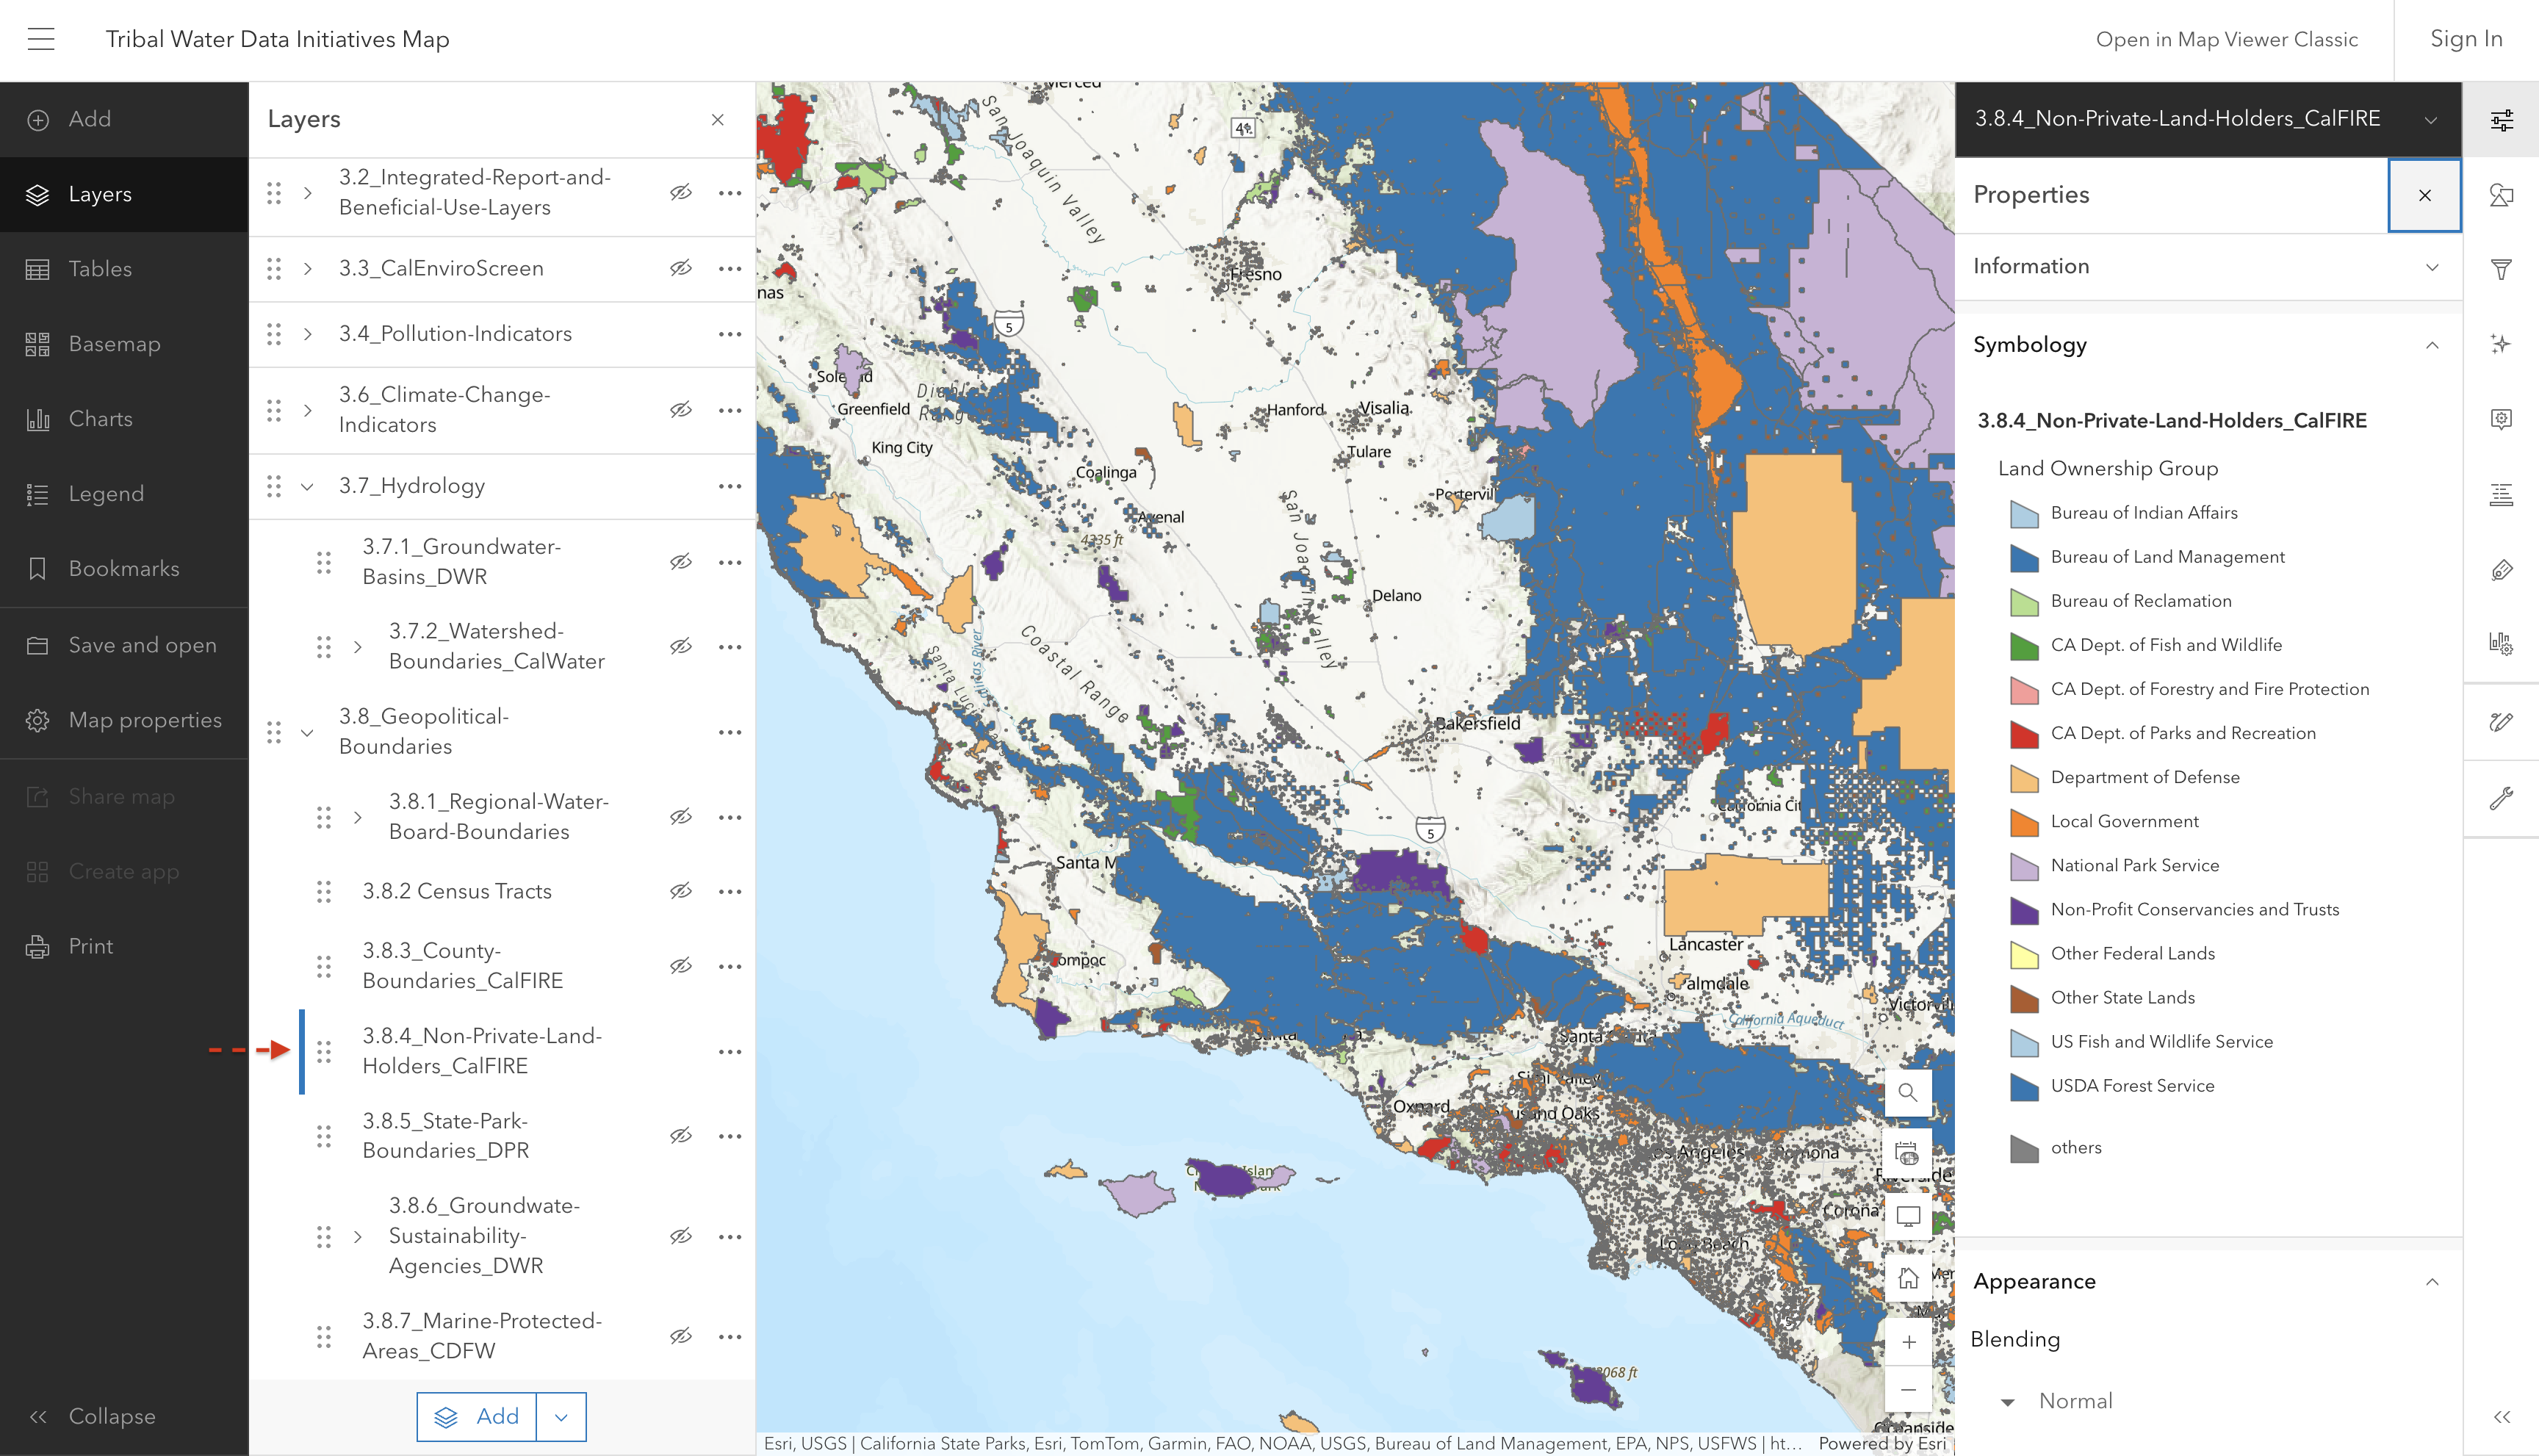
This layer shows boundaries for non-private land holders in California.

Screenshot of interactive map showing non-private land holders

Source: California Land Ownership | California State Geoportal

Source update frequency: As needed

automatically synced here

Contact: CAL FIRE eGIS

3.8.5 State Park Boundaries

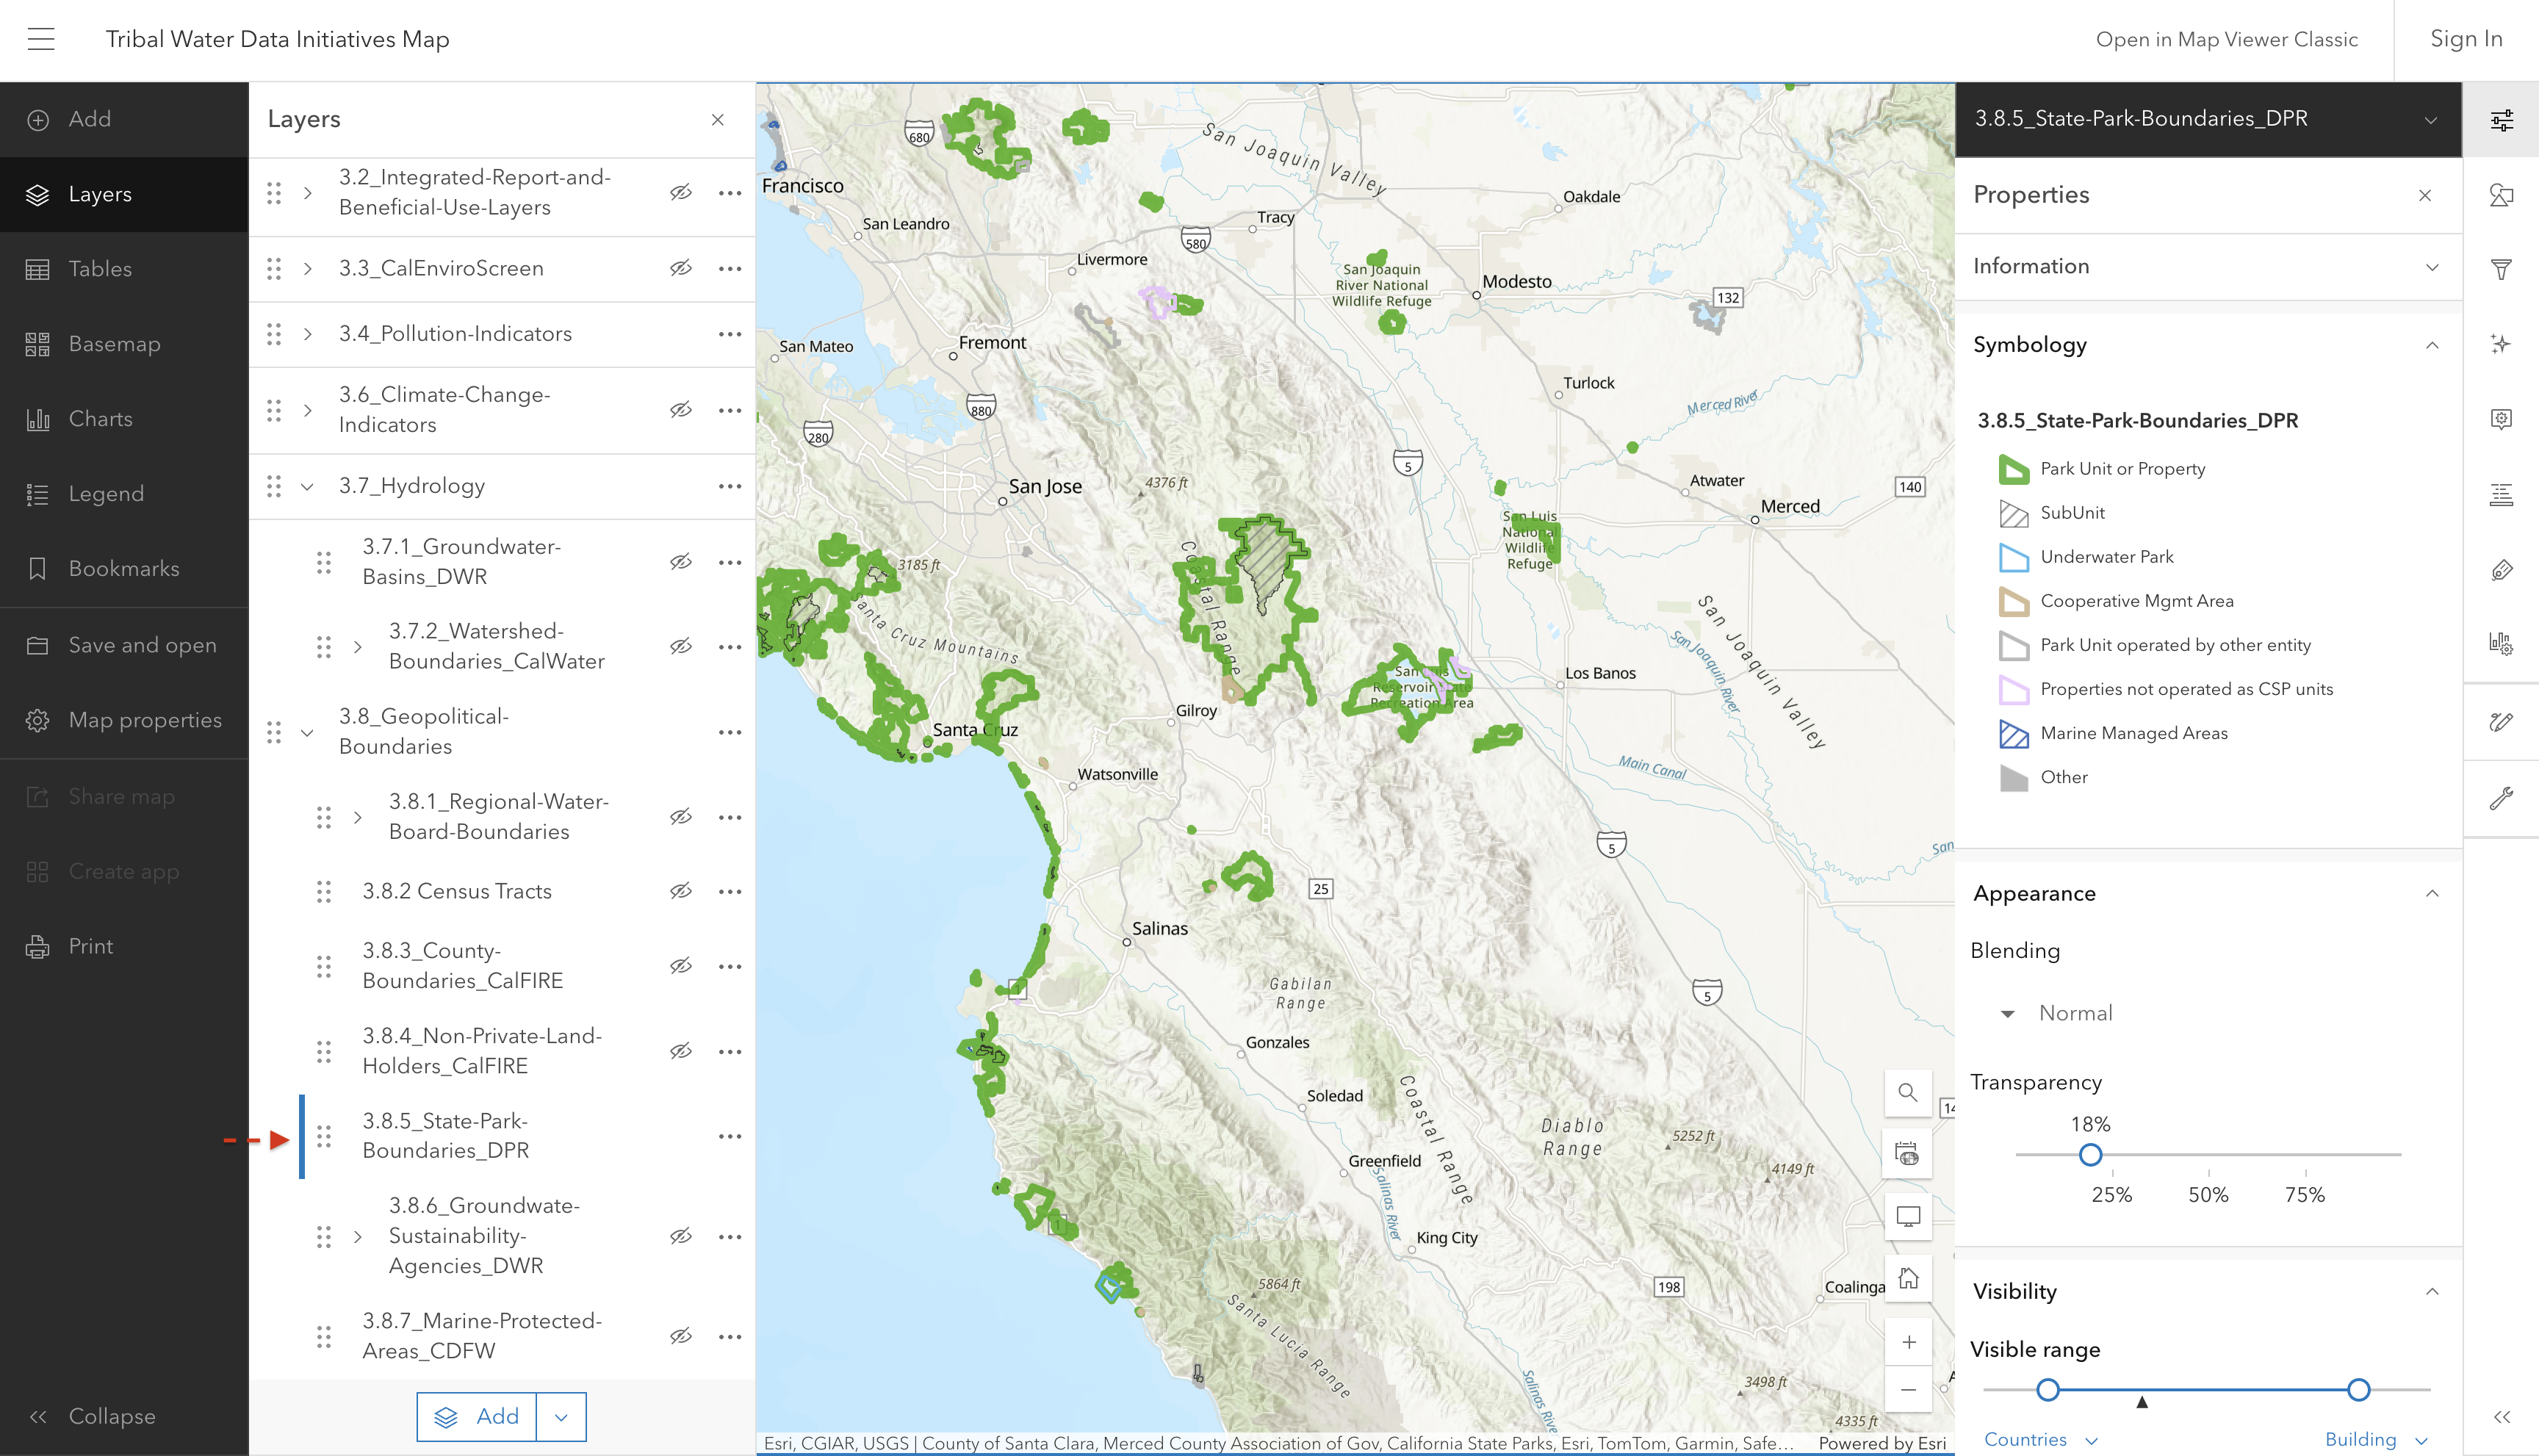
This layer shows the State Parks in California.

Screenshot of interactive map showing State Park boundaries in California

Source: California State Parks

Source update frequency: As needed

automatically synced here

Contact: Department of Parks and Recreation

3.8.6 Groundwater Sustainability Agencies

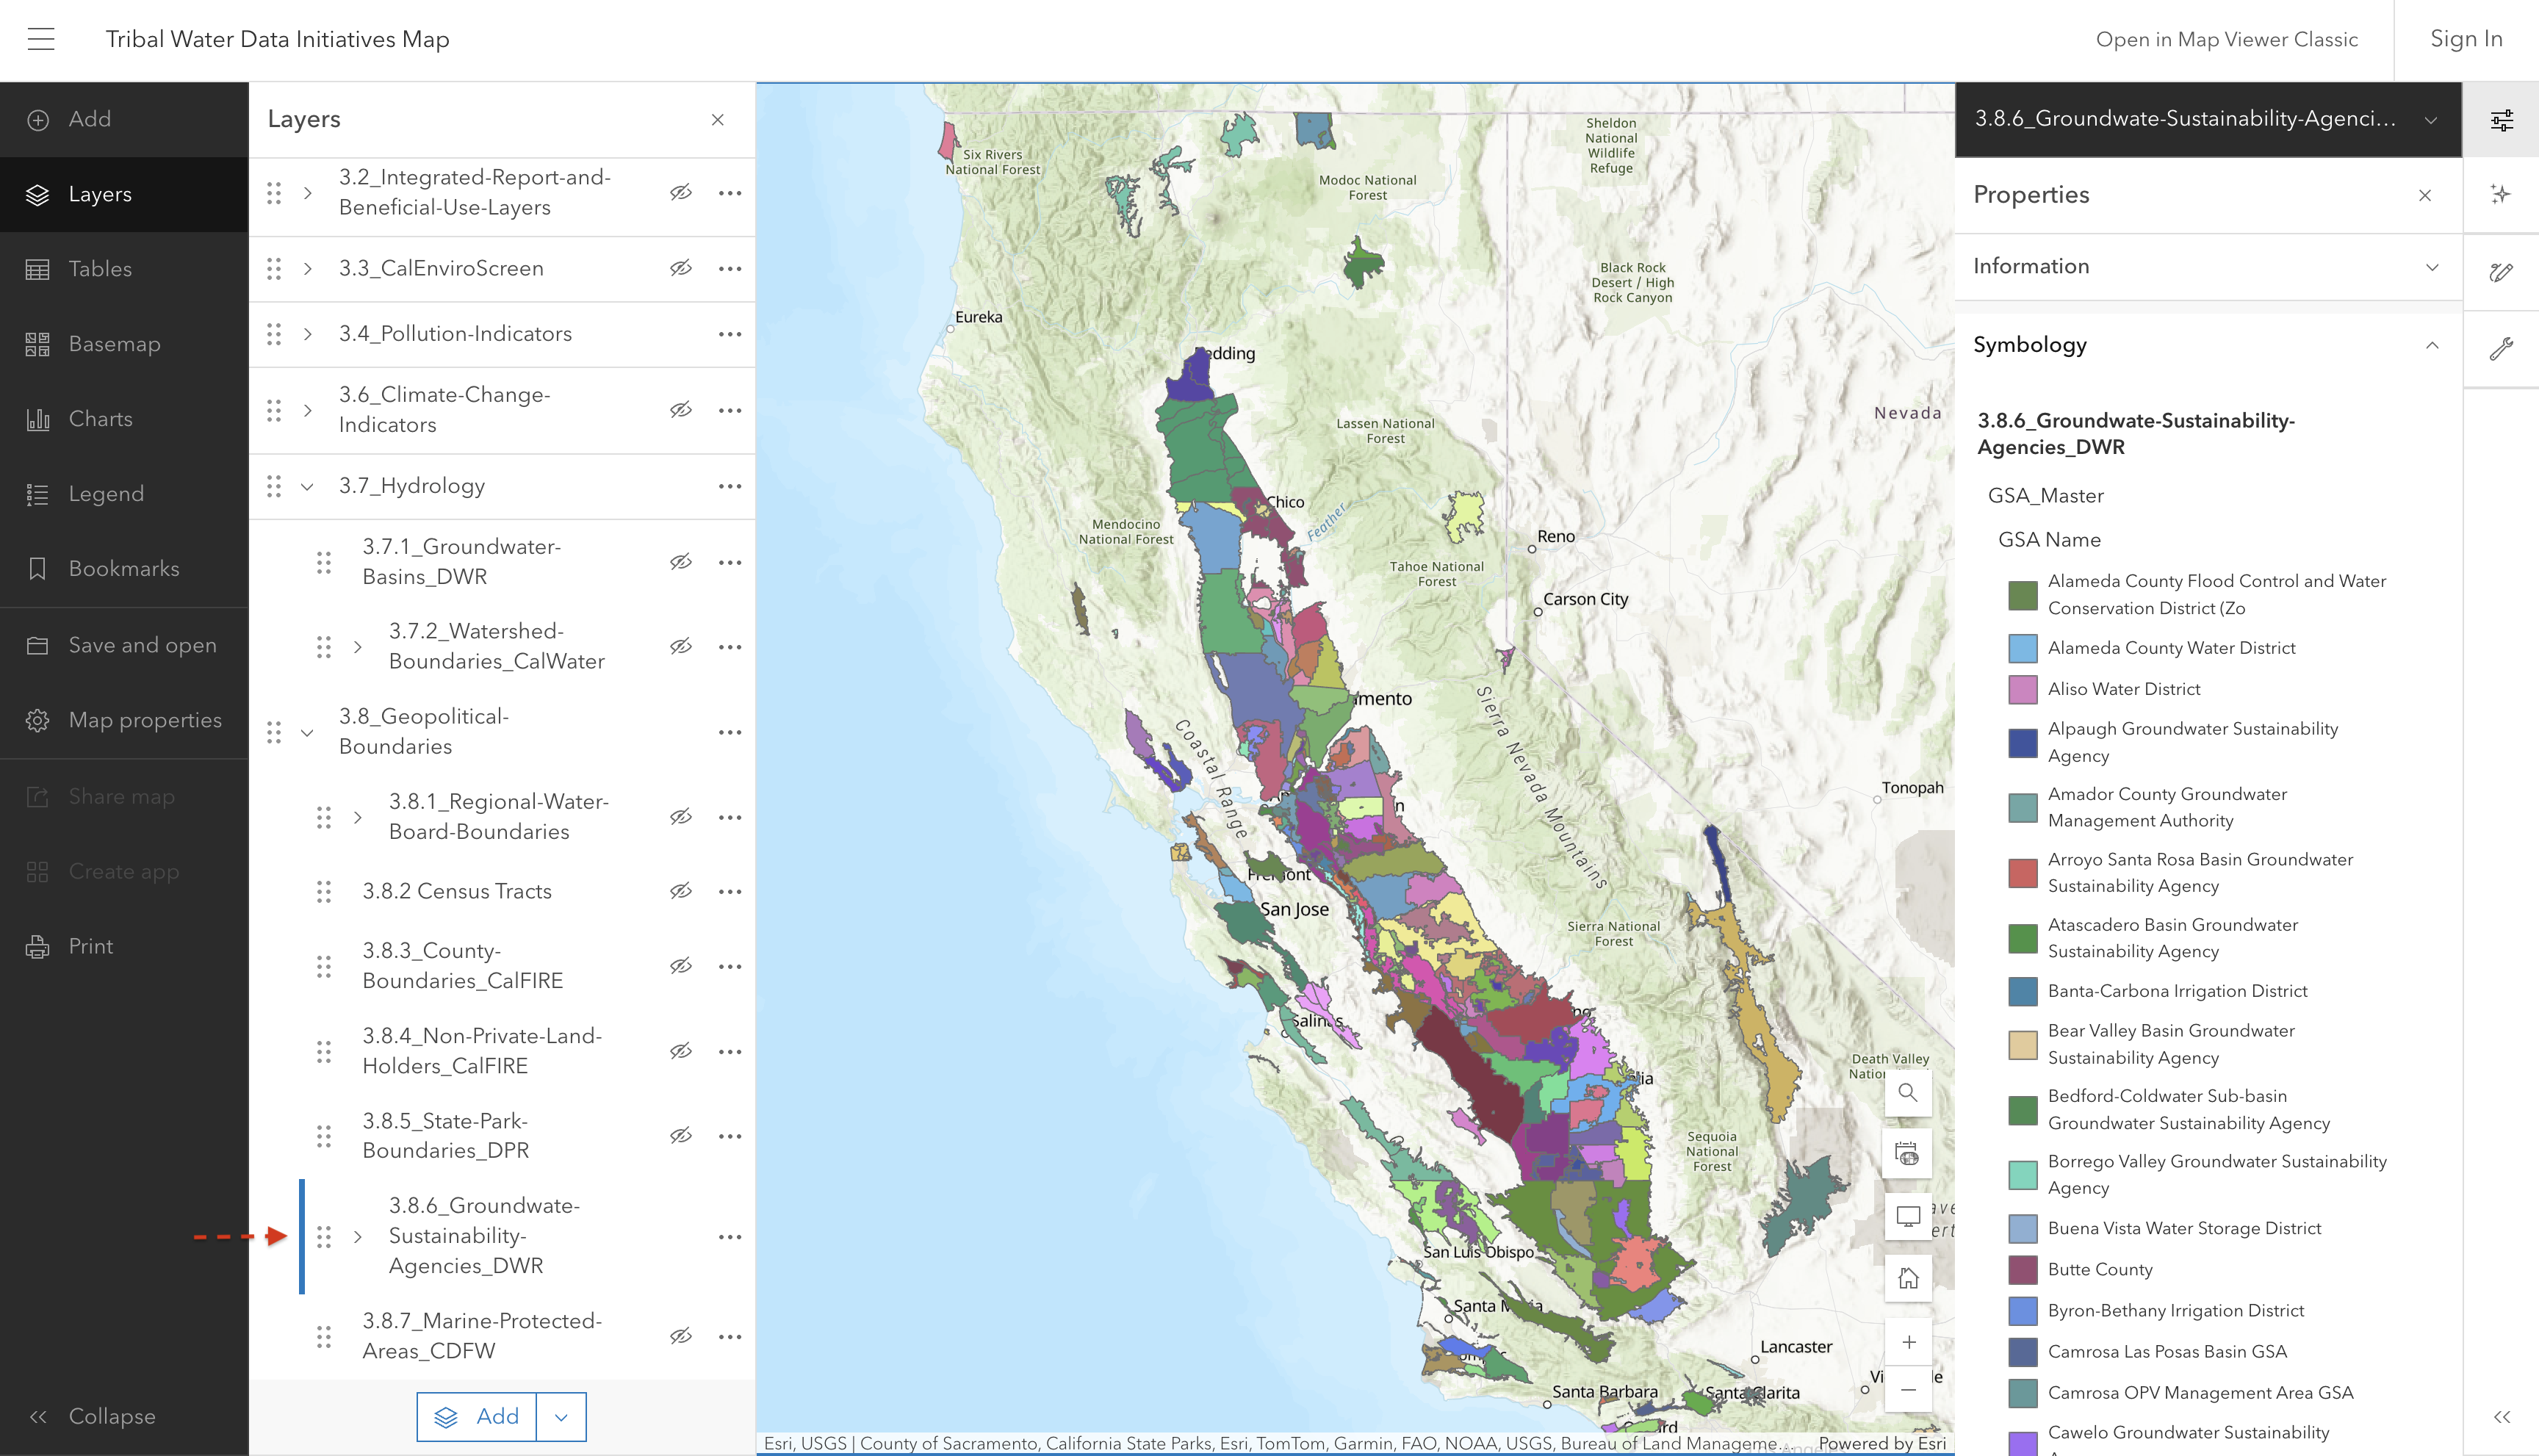
This layer shows the boundaries of California’s Groundwater Sustainability Agencies as defined on the DWR SGMA Data Viewer.

Screenshot of interactive map showing Groundwater Sustainability Agencies

Source: California Department of Water Resources, for use by Groundwater Ambient Monitoring and Assessment (GAMA) Program

Source update frequency: As needed

automatically synced here

Contact: Department of Water Resources GIS

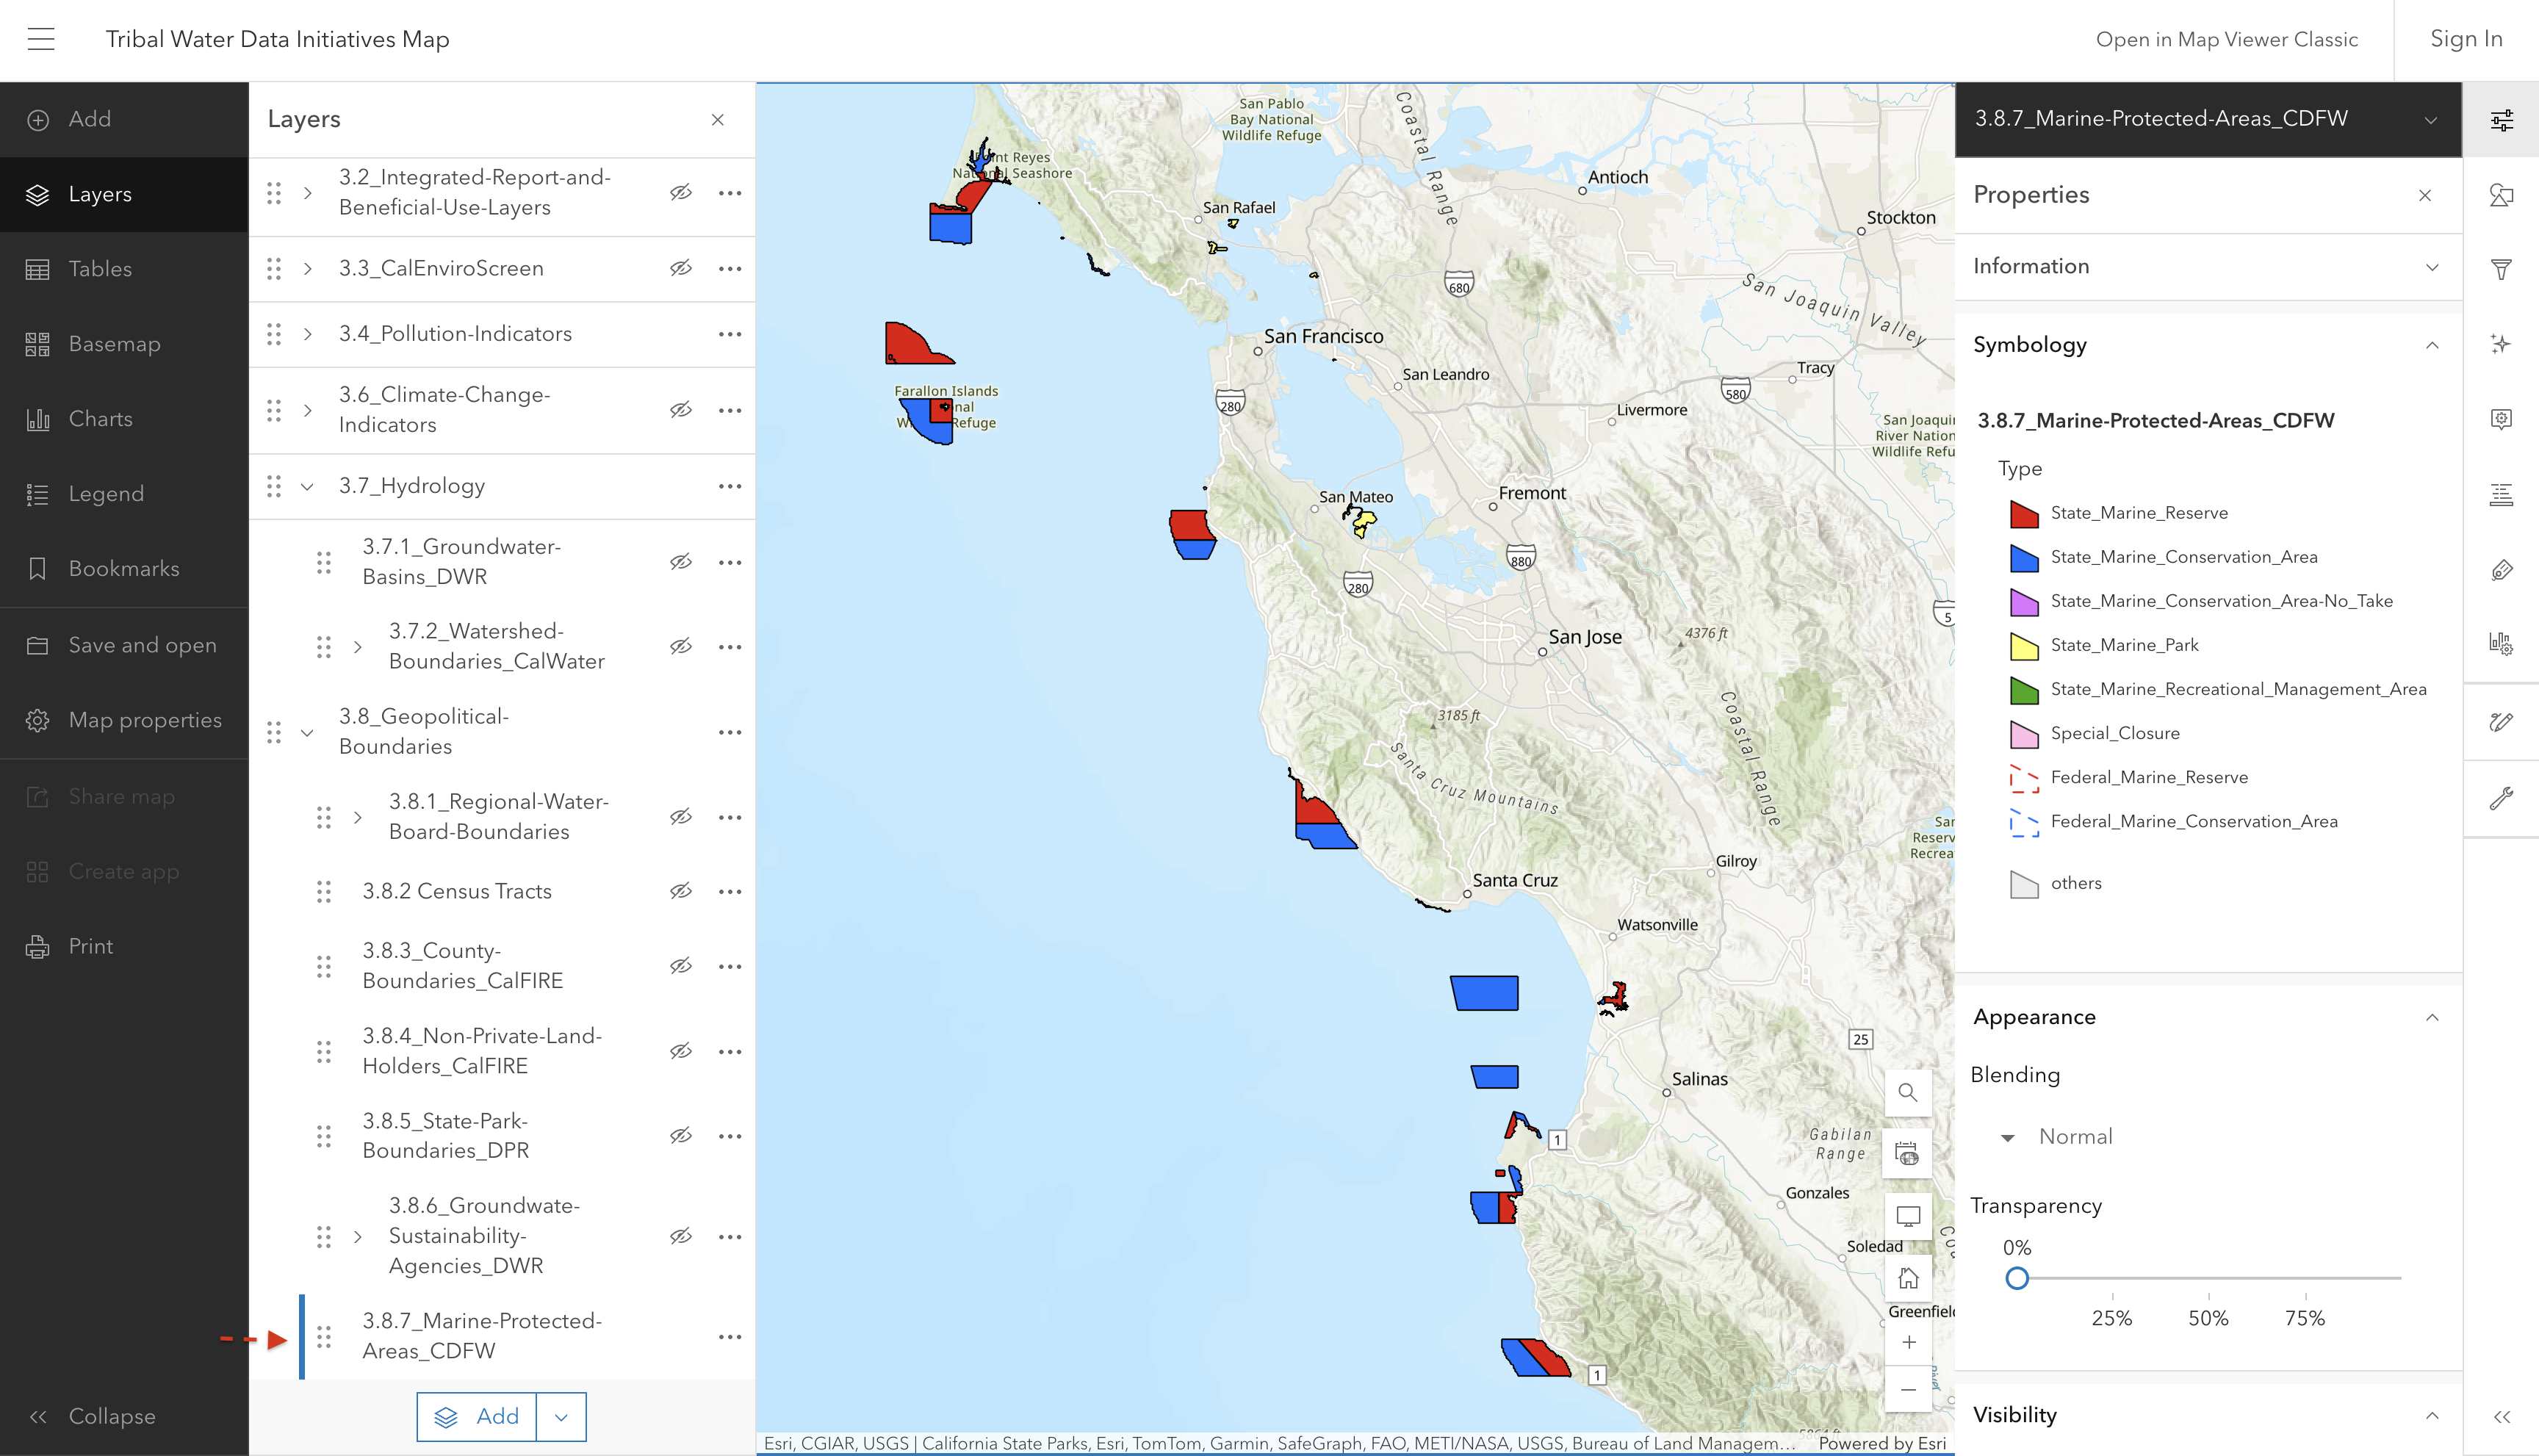
3.8.7 Marine Protected Areas

California’s MPA Network includes different types of MPAs as well as other designations. Each designation is unique in its purpose and allowed uses - CDFW

State Marine Reserve (SMP): An MPA where no take, damage, injury, or possession of any living, geologic, or cultural marine resource is allowed.

No-Take State Marine Conservation Area (NoTake SMCA): An MPA where no take of any living, geologic, or cultural resource is allowed, EXCEPT for take incidental to specified activities permitted by other agencies (e.g. infrastructure maintenance, sand renourishment).

State Marine Park (SMP): An MPA that allows some recreational take but does not allow commerical take.

State Marine Conservation Area (SMCA): An MPA where some recreational and/or commercial take of marine resources may be allowed (restrictions vary)

State Marine Recreational Management Area (SMRMA): A marine managed area where some take of marine resources may be allowed and legal waterfowl hunting is allowed (restrictions vary)

Special Closure: Prohibits or restricts access in waters adjacent to seabird rookeries or marine mammal haul-out sites.

Screenshot of interactive map showing Marine Protected Areas along the coast

Source: California Marine Protected Areas [ds582] GIS Dataset

Source update frequency: As needed

manually updated here June 2025

Contact: California Department of Fish and Wildlife - Marine Protected Areas