Bioaccumulation Science & Monitoring FAQs
What is bioaccumulation?
The word bioaccumulation is used to describe the gradual buildup of pollutants in animals, including fish or shellfish. Bioaccumulation occurs when an animal absorbs the pollutants from their environment or through their diet. Pollutants that bioaccumulate include heavy metals like mercury, polychlorinated biphenyls (PCBs), and other chemicals. As animals higher on the food chain eat those that are lower on the food chain, they accumulate more pollutants in their bodies.Humans are at the top of the food chain and when we eat animals that contain a lot of pollutants, we can experience several adverse health effects.
Bioaccumulation monitoring can give us information about which fish and shellfish are safer to eat, so we can enjoy the cultural and health benefits of eating fish and shellfish while minimizing our exposure to pollutants. Additionally, bioaccumulation monitoring can provide data and information to help evaluate how well government programs protect and restore water quality in California.
For more on bioaccumulation monitoring in California, see the SWAMP Bioaccumulation Monitoring Program webpage and related fact sheet (English, Spanish, Simplified Chinese, Traditional Chinese, Hmong, Korean, Tagalog).
For more information on which fish and shellfish are safer to eat in California waterbodies, see the Safe to Eat Portalor the OEHHA Fish Advisories website.
Why is bioaccumulation monitoring important? What difference will it make to the health of Californians?
Bioaccumulation monitoring can give us information about which fish and shellfish are safer to eat, so we can enjoy the cultural and health benefits of eating fish and shellfish while minimizing our exposure to pollutants. Additionally, bioaccumulation monitoring can provide data and information to help evaluate how well government programs protect and restore water quality in California.
The SWAMP Bioaccumulation Monitoring Program was created to provide statewide monitoring data and information that could be used to:
Assess and contribute to the protection and restoration of fishing and aquatic life beneficial uses that are impacted by the bioaccumulation of pollutants in California’s waterbodies, and
Assess the human health risks associated with the consumption of contaminated fish and shellfish in California’s freshwater and coastal ecosystems, and use that information to support the development of advisories that would inform consumers of significant health risks associated with the consumption of particular species.
The data, information, and knowledge gained from the SWAMP Bioaccumulation Monitoring Program can help shape public health and environmental policies to support the preservation, enhancement, and restoration of California’s water resources, which are vital to the health and well-being of all Californians, California Native American Tribes, the economy, and natural lands for present and future generations.
What are the sources of fish and shellfish contamination in California?
Most California fish consumption advisories involve four primary contaminants: mercury, PCBs, DDTs, and dieldrin. These and other chemical contaminants persist for long periods in the environment. Persistent organic chemicals, such as PCBs, DDT, and dieldrin accumulate in fatty tissues. Mercury, on the other hand, accumulates primarily in muscle tissue. Levels of all of these contaminants increase as they are transferred up the food chain. For example, concentrations of mercury in top predators (such as largemouth bass) may be a million times higher than concentrations in water.
These pollutants originate from a number of past and present municipal, industrial, and agricultural sources, such as mercury and gold mining, pesticide use around homes and in agriculture, leaking electrical transformers, and chemical manufacturing.
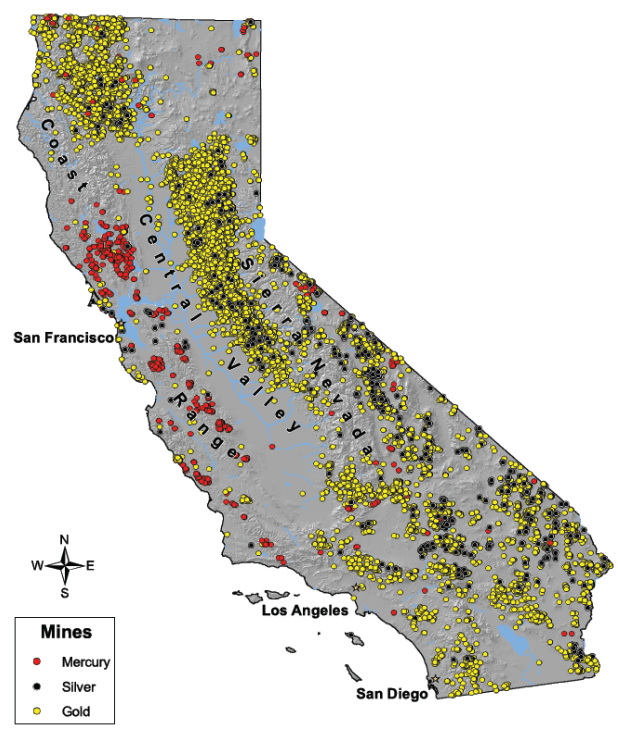
The history of gold mining in California’s Sierra Nevada Motherlode began with the Gold Rush of 1848-1849 and is well known. Mercury, mined mainly in the Coast Range, was used to amalgamate the gold. Between 1848 and 1981, 88% of the mercury mined in the United States came from the northern Coast Range of California. The map below shows the historic extent of gold, silver, and mercury mining in California. Mercury contamination from mining activities persists to this day and contributes to the mercury that accumulates in fish. Other sources of mercury include emissions from the burning of fossil fuels and oil refining, the deposition of those atmospheric emissions, municipal and industrial wastewater discharges, and urban runoff.
Who is conducting bioaccumulation monitoring in California?
The SWAMP Bioaccumulation Monitoring Program was created to provide statewide monitoring data and information that could be used to:
Assess and contribute to the protection and restoration of fishing and aquatic life beneficial uses that are impacted by the bioaccumulation of pollutants in California’s waterbodies, and
Assess the human health risks associated with the consumption of contaminated fish and shellfish in California’s freshwater and coastal ecosystems, and use that information to support the development of advisories that would inform consumers of significant health risks associated with the consumption of particular species.
The SWAMP Bioaccumulation Monitoring Program regularly coordinates or partners with other programs that conduct bioaccumulation monitoring in California, including:
- US EPA National Aquatic Resource Surveys in the nation’s coastal areas, lakes, ponds, and reservoirs, rivers and streams, and wetlands
- The San Francisco Estuary Institute (SFEI) Regional Monitoring Program for Water Quality in San Francisco Bay (Bay RMP)
- The Central Valley Regional Water Quality Control Board (Central Valley Region; Region 5) Delta Regional Monitoring Program (Delta RMP)
- The Southern California Coastal Water Research Project (SCCWRP) Southern California Bight Regional Monitoring Program (Bight RMP)
- California Department of Public Health (CDPH) Marine Biotoxin Monitoring Program
Do you conduct regular bioaccumulation monitoring in California - but are not included in the list above? Please let us know by emailing the SWAMP Bioaccumulation Monitoring Program Coordinator & Safe to Eat Workgroup Co-chair at Anna.Holder@waterboards.ca.gov!
What locations, species and pollutants have been monitored historically? What is being monitored now?
What locations, species and pollutants have been monitored historically?
The Safe to Eat Portal is the best place to find the results from extensive monitoring by the SWAMP Bioaccumulation Monitoring Program and other studies.
Date Range: Data available in the Safe to Eat Portal were collected between 1998 and 2017
Monitoring Locations: Monitoring has occurred in lakes and reservoirs, rivers and streams and coastal locations throughout California.
Species monitored: Data for over 95 species is available in the Safe to Eat Portal.
Pollutants analyzed: The main pollutants (referred to as contaminants in the Safe to Eat Portal) that have been analyzed include: mercury, selenium, PCBs (polychlorinated biphenyls), PBDEs (Polybrominated diphenyl ethers), and OC Pesticides (Organochlorine (OC) pesticides, including: chlordanes, DDT, and dieldrins)
What is being monitored now?
See the table below for recent and upcoming SWAMP Program monitoring and associated reports.
| Monitoring Year | Monitoring Element | Report |
|---|---|---|
| 2020 | Coast part 2 of 3 | 2025 |
| 2021 | Bass Lakes Panel 4 | 2024* |
| 2022 | Rivers (partial) Realignment (San Diego Region) |
2024* |
| 2023 | Bass Lakes Panel 5 | 2024 |
| 2024 | Coast part 3 of 3 | 2025 |
| 2025 | Statewide focus TBD Realignment (San Francisco Region) |
2026 |