Analyzing Data for Racial Equity

Module 1: Identifying Injustice

What is racial equity?

The Water Boards defines racial equity as a series of conditions:

  • Race no longer predicts a person’s access to water or the quality of water resources they receive
  • Race does not predict professional outcomes for our employees
  • We consistently consider racial equity impacts before we make decisions

What does inequity look like?

  • The Water Boards defines equity as “a future where race no longer predicts a person’s access to water or the quality of water resources they receive”
  • It follows that inequity looks like a difference or disparity in access or resources

Why are we interested in disparity?

  • A difference in exposure to harm or access to resources could represent injustice.
  • Disparate outcomes can hint at the cause or mechanism of injustice.

Why are we interested in mechanisms?

Considering the mechanism of injustice allows us to:

  • Contemplate effective interventions.
  • Identify other places affected by the same cause or mechanism.

Exercise: Failing water system in Lamont

Background

As of 2024, California had 220 failing drinking water systems serving nearly half a million people.

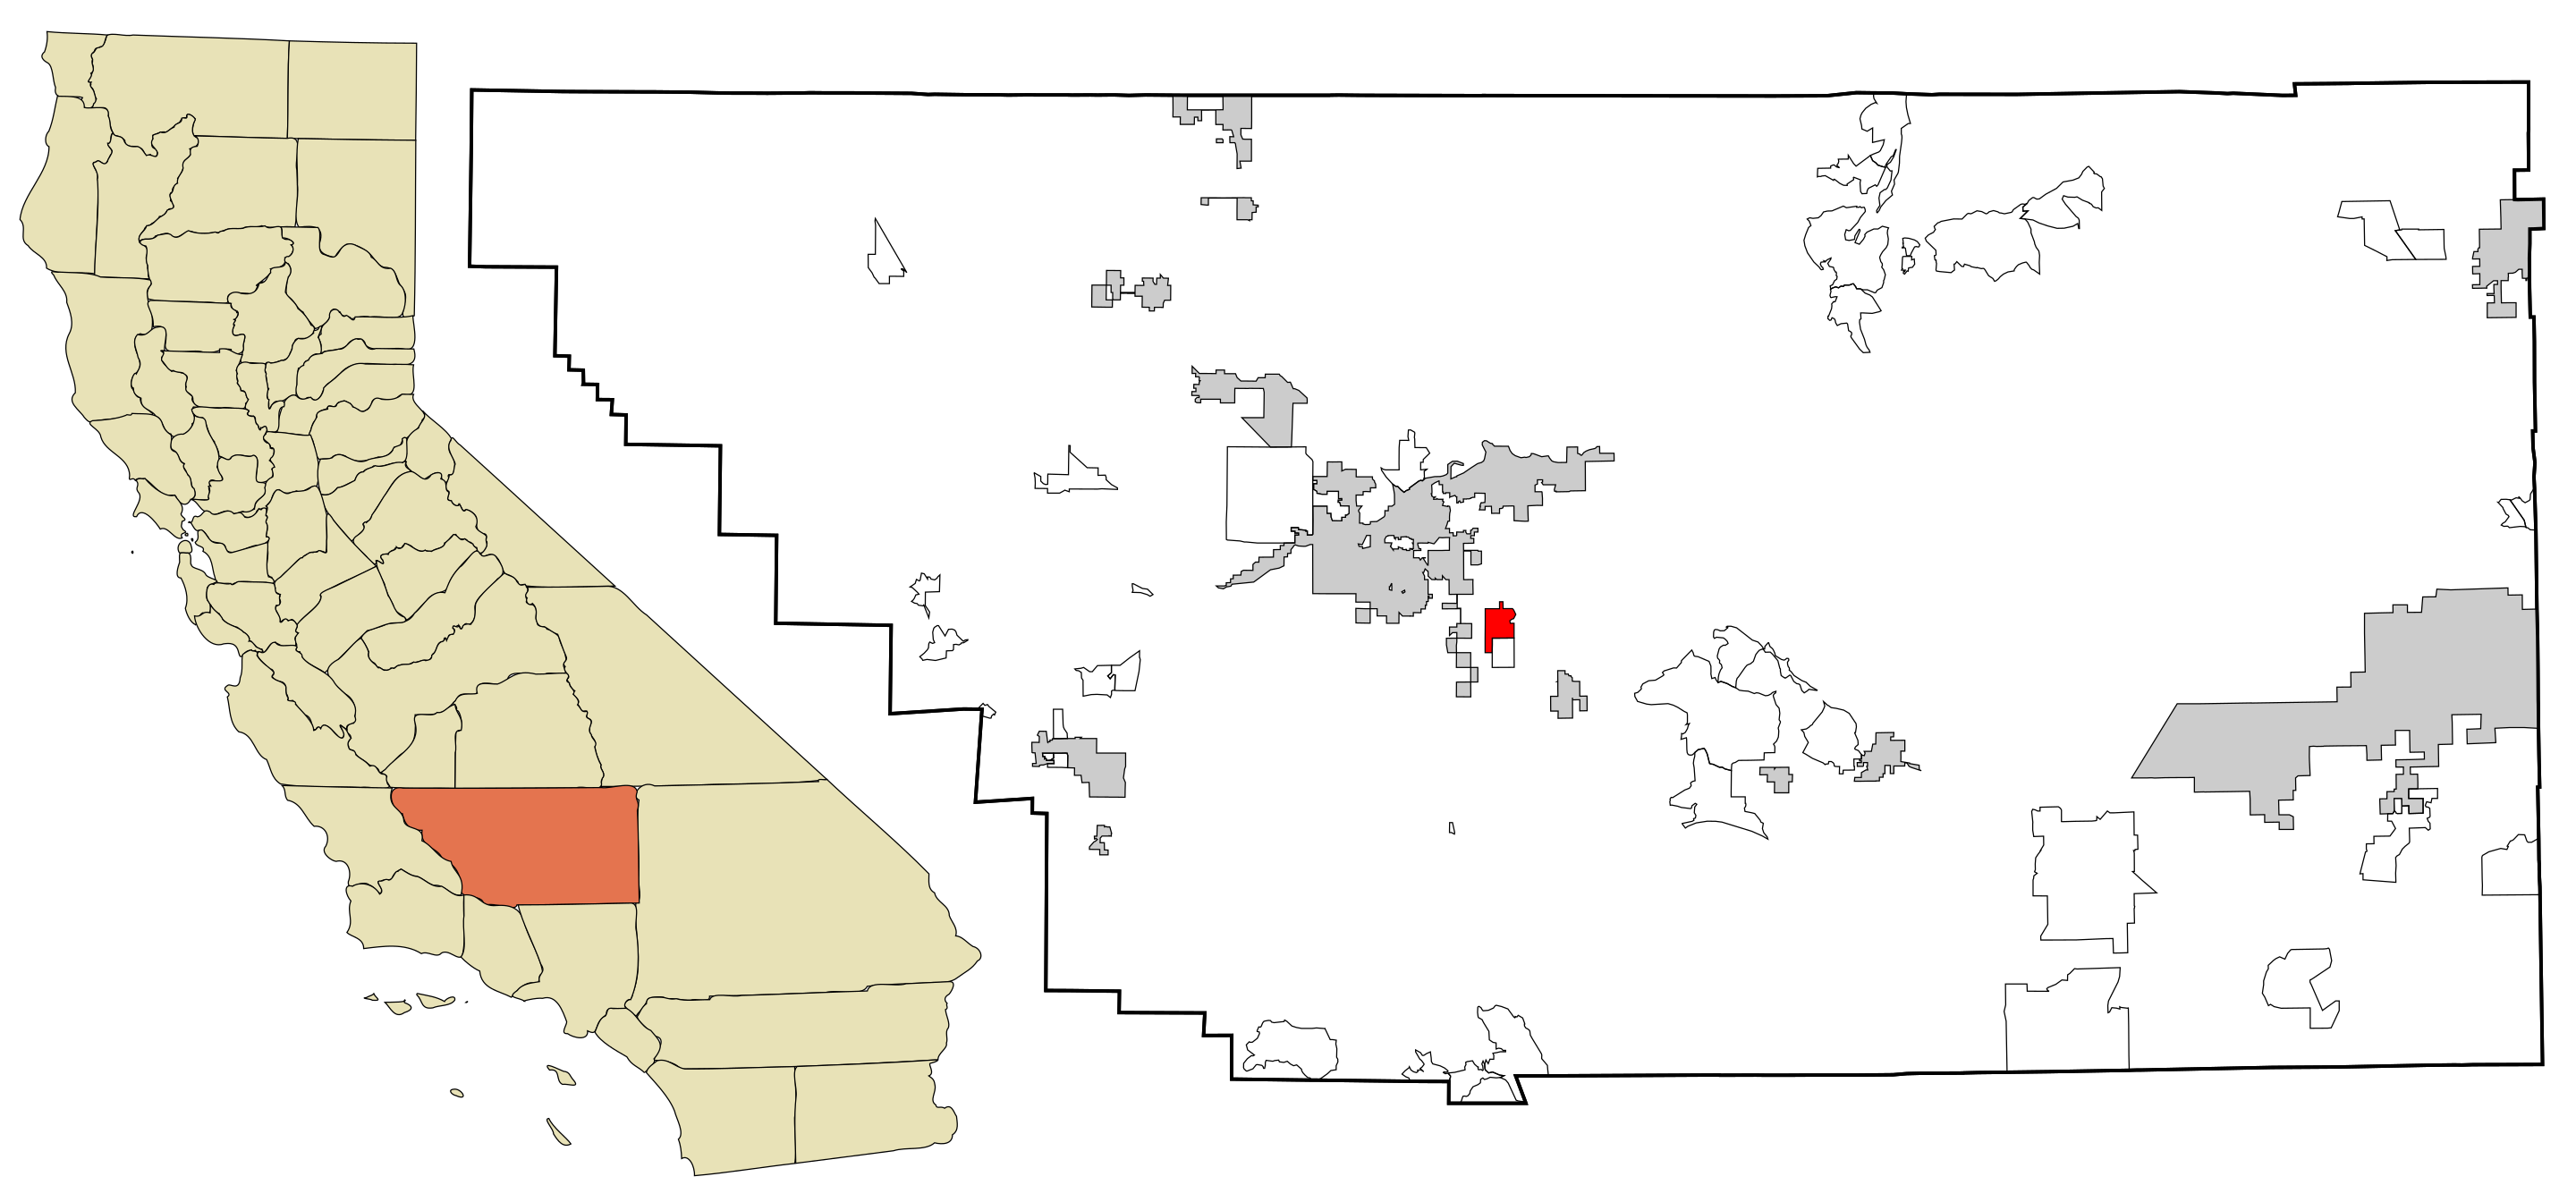
One of them, Lamont, received $25 million in Water Board funding to help fix their water system, which included three wells exceeding the Maximum Contaminant Level of arsenic and 1,2,3-tricholoropropane.

Interrogating the failing water system in Lamont

  • Why is the water contaminated?
  • Who was exposed to water from this system? How?
  • Are there racial disparities in exposure? Why?
  • Other questions?

Reproducible data analysis

Why work in R (or another scriping language or software, such as Excel)?

  • Automate and reproduce your analysis
  • Public data resources are being removed, e.g., the EPA’s Environmental Justice Screen. Lower level resources, like APIs, are less visible and therefore lower priority for censoring

Who was exposed?

Let’s use Census data to determine who lives in Lamont, i.e., who was exposed to contaminated water. We’ll use the tidycensus R package to retrieve 2020 Census race/ethnicity data by Census block.

Who was exposed?

Get your Census API key.

Screenshot of the Census API key request form

Who was exposed?

Retrieve Census data.

1STATE <- "CA"
COUNTY <- "Kern"
CITY <- "Lamont"

2racevars <- c(
  White = "P2_005N",
  Black = "P2_006N",
  AmericanIndian = "P2_007N",
  Asian = "P2_008N",
  HawaiianPacificIslander = "P2_009N",
  Other = "P2_010N",
  TwoOrMoreRaces = "P2_011N",
  Hispanic = "P2_002N"
)
1
Define the city, county, and state you’d like to retrieve Census data for.
2
Define the Census variables you’d like to retrieve.

Who was exposed?

1# tidycensus::census_api_key(YOUR KEY HERE)

2long_county_blocks <- get_decennial(year = 2020,
                               sumfile = "pl",
                               state = STATE,
                               county = COUNTY,
                               geography = "block",
3                               variables = racevars,
                               summary_var = "P2_001N",
4                               geometry = TRUE) %>%
5  mutate(percent = 100 * (value / summary_value))
1
Store your API key with tidycensus.
2
Use the get_decennial() method from tidycensus to retrieve 2020 data for our specified state and county at the block level.
3
Specify which variables to retrieve, and define a summary variable. Usually, you’ll use the total, or universe, variable as your summary variable so you can, e.g., calculate proportions.
4
Tell tidycensus to return results with geospatial information, for mapping.
5
Add a new column to your results that calculates the proportion of the population each group accounts for.

  |                                                                            
  |                                                                      |   0%
  |                                                                            
  |                                                                      |   1%
  |                                                                            
  |=                                                                     |   1%
  |                                                                            
  |=                                                                     |   2%
  |                                                                            
  |==                                                                    |   2%
  |                                                                            
  |==                                                                    |   3%
  |                                                                            
  |==                                                                    |   4%
  |                                                                            
  |===                                                                   |   4%
  |                                                                            
  |===                                                                   |   5%
  |                                                                            
  |====                                                                  |   5%
  |                                                                            
  |====                                                                  |   6%
  |                                                                            
  |=====                                                                 |   6%
  |                                                                            
  |=====                                                                 |   7%
  |                                                                            
  |=====                                                                 |   8%
  |                                                                            
  |======                                                                |   8%
  |                                                                            
  |======                                                                |   9%
  |                                                                            
  |=======                                                               |   9%
  |                                                                            
  |=======                                                               |  10%
  |                                                                            
  |=======                                                               |  11%
  |                                                                            
  |========                                                              |  11%
  |                                                                            
  |========                                                              |  12%
  |                                                                            
  |=========                                                             |  12%
  |                                                                            
  |=========                                                             |  13%
  |                                                                            
  |=========                                                             |  14%
  |                                                                            
  |==========                                                            |  14%
  |                                                                            
  |==========                                                            |  15%
  |                                                                            
  |===========                                                           |  15%
  |                                                                            
  |===========                                                           |  16%
  |                                                                            
  |============                                                          |  16%
  |                                                                            
  |============                                                          |  17%
  |                                                                            
  |============                                                          |  18%
  |                                                                            
  |=============                                                         |  18%
  |                                                                            
  |=============                                                         |  19%
  |                                                                            
  |==============                                                        |  19%
  |                                                                            
  |==============                                                        |  20%
  |                                                                            
  |==============                                                        |  21%
  |                                                                            
  |===============                                                       |  21%
  |                                                                            
  |===============                                                       |  22%
  |                                                                            
  |================                                                      |  22%
  |                                                                            
  |================                                                      |  23%
  |                                                                            
  |================                                                      |  24%
  |                                                                            
  |=================                                                     |  24%
  |                                                                            
  |=================                                                     |  25%
  |                                                                            
  |==================                                                    |  25%
  |                                                                            
  |==================                                                    |  26%
  |                                                                            
  |===================                                                   |  26%
  |                                                                            
  |===================                                                   |  27%
  |                                                                            
  |===================                                                   |  28%
  |                                                                            
  |====================                                                  |  28%
  |                                                                            
  |====================                                                  |  29%
  |                                                                            
  |=====================                                                 |  29%
  |                                                                            
  |=====================                                                 |  30%
  |                                                                            
  |=====================                                                 |  31%
  |                                                                            
  |======================                                                |  31%
  |                                                                            
  |======================                                                |  32%
  |                                                                            
  |=======================                                               |  32%
  |                                                                            
  |=======================                                               |  33%
  |                                                                            
  |=======================                                               |  34%
  |                                                                            
  |========================                                              |  34%
  |                                                                            
  |========================                                              |  35%
  |                                                                            
  |=========================                                             |  35%
  |                                                                            
  |=========================                                             |  36%
  |                                                                            
  |==========================                                            |  36%
  |                                                                            
  |==========================                                            |  37%
  |                                                                            
  |==========================                                            |  38%
  |                                                                            
  |===========================                                           |  38%
  |                                                                            
  |===========================                                           |  39%
  |                                                                            
  |============================                                          |  39%
  |                                                                            
  |============================                                          |  40%
  |                                                                            
  |============================                                          |  41%
  |                                                                            
  |=============================                                         |  41%
  |                                                                            
  |=============================                                         |  42%
  |                                                                            
  |==============================                                        |  42%
  |                                                                            
  |==============================                                        |  43%
  |                                                                            
  |==============================                                        |  44%
  |                                                                            
  |===============================                                       |  44%
  |                                                                            
  |===============================                                       |  45%
  |                                                                            
  |================================                                      |  45%
  |                                                                            
  |================================                                      |  46%
  |                                                                            
  |=================================                                     |  46%
  |                                                                            
  |=================================                                     |  47%
  |                                                                            
  |=================================                                     |  48%
  |                                                                            
  |==================================                                    |  48%
  |                                                                            
  |==================================                                    |  49%
  |                                                                            
  |===================================                                   |  49%
  |                                                                            
  |===================================                                   |  50%
  |                                                                            
  |===================================                                   |  51%
  |                                                                            
  |====================================                                  |  51%
  |                                                                            
  |====================================                                  |  52%
  |                                                                            
  |=====================================                                 |  52%
  |                                                                            
  |=====================================                                 |  53%
  |                                                                            
  |=====================================                                 |  54%
  |                                                                            
  |======================================                                |  54%
  |                                                                            
  |======================================                                |  55%
  |                                                                            
  |=======================================                               |  55%
  |                                                                            
  |=======================================                               |  56%
  |                                                                            
  |========================================                              |  56%
  |                                                                            
  |========================================                              |  57%
  |                                                                            
  |========================================                              |  58%
  |                                                                            
  |=========================================                             |  58%
  |                                                                            
  |=========================================                             |  59%
  |                                                                            
  |==========================================                            |  59%
  |                                                                            
  |==========================================                            |  60%
  |                                                                            
  |==========================================                            |  61%
  |                                                                            
  |===========================================                           |  61%
  |                                                                            
  |===========================================                           |  62%
  |                                                                            
  |============================================                          |  62%
  |                                                                            
  |============================================                          |  63%
  |                                                                            
  |============================================                          |  64%
  |                                                                            
  |=============================================                         |  64%
  |                                                                            
  |=============================================                         |  65%
  |                                                                            
  |==============================================                        |  65%
  |                                                                            
  |==============================================                        |  66%
  |                                                                            
  |===============================================                       |  66%
  |                                                                            
  |===============================================                       |  67%
  |                                                                            
  |===============================================                       |  68%
  |                                                                            
  |================================================                      |  68%
  |                                                                            
  |================================================                      |  69%
  |                                                                            
  |=================================================                     |  69%
  |                                                                            
  |=================================================                     |  70%
  |                                                                            
  |=================================================                     |  71%
  |                                                                            
  |==================================================                    |  71%
  |                                                                            
  |==================================================                    |  72%
  |                                                                            
  |===================================================                   |  72%
  |                                                                            
  |===================================================                   |  73%
  |                                                                            
  |===================================================                   |  74%
  |                                                                            
  |====================================================                  |  74%
  |                                                                            
  |====================================================                  |  75%
  |                                                                            
  |=====================================================                 |  75%
  |                                                                            
  |=====================================================                 |  76%
  |                                                                            
  |======================================================                |  76%
  |                                                                            
  |======================================================                |  77%
  |                                                                            
  |======================================================                |  78%
  |                                                                            
  |=======================================================               |  78%
  |                                                                            
  |=======================================================               |  79%
  |                                                                            
  |========================================================              |  79%
  |                                                                            
  |========================================================              |  80%
  |                                                                            
  |========================================================              |  81%
  |                                                                            
  |=========================================================             |  81%
  |                                                                            
  |=========================================================             |  82%
  |                                                                            
  |==========================================================            |  82%
  |                                                                            
  |==========================================================            |  83%
  |                                                                            
  |==========================================================            |  84%
  |                                                                            
  |===========================================================           |  84%
  |                                                                            
  |===========================================================           |  85%
  |                                                                            
  |============================================================          |  85%
  |                                                                            
  |============================================================          |  86%
  |                                                                            
  |=============================================================         |  87%
  |                                                                            
  |=============================================================         |  88%
  |                                                                            
  |==============================================================        |  88%
  |                                                                            
  |==============================================================        |  89%
  |                                                                            
  |===============================================================       |  89%
  |                                                                            
  |===============================================================       |  90%
  |                                                                            
  |===============================================================       |  91%
  |                                                                            
  |================================================================      |  91%
  |                                                                            
  |================================================================      |  92%
  |                                                                            
  |=================================================================     |  92%
  |                                                                            
  |=================================================================     |  93%
  |                                                                            
  |=================================================================     |  94%
  |                                                                            
  |==================================================================    |  94%
  |                                                                            
  |==================================================================    |  95%
  |                                                                            
  |===================================================================   |  95%
  |                                                                            
  |===================================================================   |  96%
  |                                                                            
  |====================================================================  |  96%
  |                                                                            
  |====================================================================  |  97%
  |                                                                            
  |====================================================================  |  98%
  |                                                                            
  |===================================================================== |  98%
  |                                                                            
  |===================================================================== |  99%
  |                                                                            
  |======================================================================|  99%
  |                                                                            
  |======================================================================| 100%

Who was exposed?

GEOID NAME variable value summary_value geometry percent
060290009091006 Block 1006, Block Group 1, Census Tract 9.09, Kern County, California White 6 26 MULTIPOLYGON (((-119 35, -1… 23
060290009091006 Block 1006, Block Group 1, Census Tract 9.09, Kern County, California Black 0 26 MULTIPOLYGON (((-119 35, -1… 0
060290009091006 Block 1006, Block Group 1, Census Tract 9.09, Kern County, California AmericanIndian 0 26 MULTIPOLYGON (((-119 35, -1… 0
060290009091006 Block 1006, Block Group 1, Census Tract 9.09, Kern County, California Asian 0 26 MULTIPOLYGON (((-119 35, -1… 0
060290009091006 Block 1006, Block Group 1, Census Tract 9.09, Kern County, California HawaiianPacificIslander 0 26 MULTIPOLYGON (((-119 35, -1… 0
060290009091006 Block 1006, Block Group 1, Census Tract 9.09, Kern County, California Other 0 26 MULTIPOLYGON (((-119 35, -1… 0
060290009091006 Block 1006, Block Group 1, Census Tract 9.09, Kern County, California TwoOrMoreRaces 4 26 MULTIPOLYGON (((-119 35, -1… 15
060290009091006 Block 1006, Block Group 1, Census Tract 9.09, Kern County, California Hispanic 16 26 MULTIPOLYGON (((-119 35, -1… 62
060290009084001 Block 4001, Block Group 4, Census Tract 9.08, Kern County, California White 30 101 MULTIPOLYGON (((-119 35, -1… 30
060290009084001 Block 4001, Block Group 4, Census Tract 9.08, Kern County, California Black 3 101 MULTIPOLYGON (((-119 35, -1… 3

Who was exposed?

1county_blocks <- long_county_blocks %>%
                    pivot_wider(names_from = variable,
                    values_from = c(value, percent))
1
Transform your results from long data (one row for each variable for each block) to wide data (one row for each block with a column for each variable).

Who was exposed?

GEOID NAME summary_value geometry value_White value_Black value_AmericanIndian value_Asian value_HawaiianPacificIslander value_Other value_TwoOrMoreRaces value_Hispanic percent_White percent_Black percent_AmericanIndian percent_Asian percent_HawaiianPacificIslander percent_Other percent_TwoOrMoreRaces percent_Hispanic
060290009091006 Block 1006, Block Group 1, Census Tract 9.09, Kern County, California 26 MULTIPOLYGON (((-119 35, -1… 6 0 0 0 0 0 4 16 23 0 0.00 0.0 0 0.00 15.4 62
060290009084001 Block 4001, Block Group 4, Census Tract 9.08, Kern County, California 101 MULTIPOLYGON (((-119 35, -1… 30 3 0 0 0 1 2 65 30 3 0.00 0.0 0 0.99 2.0 64
060290052083005 Block 3005, Block Group 3, Census Tract 52.08, Kern County, California 0 MULTIPOLYGON (((-119 36, -1… 0 0 0 0 0 0 0 0 NaN NaN NaN NaN NaN NaN NaN NaN
060290039002082 Block 2082, Block Group 2, Census Tract 39, Kern County, California 0 MULTIPOLYGON (((-119 36, -1… 0 0 0 0 0 0 0 0 NaN NaN NaN NaN NaN NaN NaN NaN
060290051044023 Block 4023, Block Group 4, Census Tract 51.04, Kern County, California 0 MULTIPOLYGON (((-119 35, -1… 0 0 0 0 0 0 0 0 NaN NaN NaN NaN NaN NaN NaN NaN
060290052071089 Block 1089, Block Group 1, Census Tract 52.07, Kern County, California 19 MULTIPOLYGON (((-118 36, -1… 11 0 0 0 0 0 1 7 58 0 0.00 0.0 0 0.00 5.3 37
060290060041036 Block 1036, Block Group 1, Census Tract 60.04, Kern County, California 0 MULTIPOLYGON (((-119 35, -1… 0 0 0 0 0 0 0 0 NaN NaN NaN NaN NaN NaN NaN NaN
060290032152018 Block 2018, Block Group 2, Census Tract 32.15, Kern County, California 104 MULTIPOLYGON (((-119 35, -1… 39 0 1 5 0 0 0 59 38 0 0.96 4.8 0 0.00 0.0 57
060290031123019 Block 3019, Block Group 3, Census Tract 31.12, Kern County, California 0 MULTIPOLYGON (((-119 35, -1… 0 0 0 0 0 0 0 0 NaN NaN NaN NaN NaN NaN NaN NaN
060290052061235 Block 1235, Block Group 1, Census Tract 52.06, Kern County, California 0 MULTIPOLYGON (((-119 35, -1… 0 0 0 0 0 0 0 0 NaN NaN NaN NaN NaN NaN NaN NaN

Who was exposed?

1city_boundary <- tigris::places(state = STATE, cb = TRUE) %>%
  dplyr::filter(NAME == CITY)

2city_blocks <- st_filter(county_blocks, city_boundary)
1
Retrieve the shape of the specified city with the places() method from the tigris package.
2
Filter your Census results to only blocks within the specified city with the st_filter() method from the sf package.

  |                                                                            
  |                                                                      |   0%
  |                                                                            
  |======                                                                |   9%
  |                                                                            
  |================                                                      |  23%
  |                                                                            
  |==================                                                    |  26%
  |                                                                            
  |======================                                                |  31%
  |                                                                            
  |===============================                                       |  45%
  |                                                                            
  |======================================================================| 100%

Who was exposed?

Aggregate block-level results.

race_ethnicity_summary <- city_blocks %>% 
1    summarise(
      total_population=sum(summary_value), 
      n_white=sum(value_White), 
      pct_white=n_white/total_population, 
      n_black=sum(value_Black), 
      pct_black=n_black/total_population, 
      n_hispanic=sum(value_Hispanic), 
      pct_hispanic=n_hispanic/total_population
    )
1
Aggregate per-block data to total population by race/ethnicity group.
Population Count Percent
White 514 3.3
Black 15 0.098
Hispanic 14,650 95

Assumptions

What are some of the assumptions that we’ve made in this analysis, either explicitly or implicitly, that could pose a problem?

🛎️ Chime in or share your ideas in the chat.

Assumptions

What are some of the assumptions that we’ve made in this analysis, either explicitly or implicitly, that could pose a problem?

  • 2020 Census Data accurately reflects the population in 2024
  • The demographic groups we selected are representative of the entire population
  • Everyone uses public water
  • The population of Lamont is evenly distributed

Challenging assumptions

Assumption 1: 2020 Census Data accurately reflects the population in 2024

Why decennial Census block data?

  • Blocks are the smallest geographic unit but they are only available from decennial Census, not ACS estimates
  • One reason for this is margin of error, which tends to be higher among smaller populations
  • The ACS gives us access to block groups, but as the population of Lamont is small, the population of block groups may be small, so estimates may still have high margins of error

Assumption 1: 2020 Census Data accurately reflects the population in 2024

Why decennial Census block data?

  • Census data is a count, while ACS data is an estimate
    • Some groups are more likely to be underrepresented in a count, but estimates can have large margin of error

Assumption 1: 2020 Census Data accurately reflects the population in 2024

Consider trade offs!

  • Recent vs. precise
  • Estimate vs. count
  • More vs. less granular

Assumption 2: Selected demographic groups are representative

We selected three categories of race/ethnicity. Do they account for 100% of the population?

Population Count Percent
White 514 3.3
Black 15 0.098
Hispanic 14,650 95
Analysis population Total population Difference
15,179 15,361 -182

Assumption 2: Selected demographic groups are representative

race_ethnicity_summary <- city_blocks %>%
    summarise(total_population = sum(summary_value), n_white = sum(value_White),
        pct_white = n_white/total_population, n_black = sum(value_Black),
        pct_black = n_black/total_population, n_hispanic = sum(value_Hispanic),
        pct_hispanic = n_hispanic/total_population)

Assumption 2: Selected demographic groups are representative

race_ethnicity_summary <- city_blocks %>%
    summarise(total_population = sum(summary_value), n_white = sum(value_White),
        pct_white = n_white/total_population, n_black = sum(value_Black),
        pct_black = n_black/total_population, n_hispanic = sum(value_Hispanic),
        pct_hispanic = n_hispanic/total_population, n_amind = sum(value_AmericanIndian),
        pct_amind = n_amind/total_population, n_asian = sum(value_Asian),
        pct_asian = n_asian/total_population, n_pi = sum(value_HawaiianPacificIslander),
        pct_pi = n_pi/total_population, n_other = sum(value_Other),
        pct_other = n_other/total_population, n_tom = sum(value_TwoOrMoreRaces),
        pct_tom = n_tom/total_population)

Assumption 2: Selected demographic groups are representative

Population Count Percent
White 514 3.3
Black 15 0.098
Hispanic 14,650 95
American Indian 19 0.12
Asian 57 0.37
Hawaiian/Pacific Islander 0 0
Other 30 0.2
Two or More 76 0.49
Analysis population Total population Difference
15,361 15,361 0

Assumption 2: Selected demographic groups are representative

PSA: The way the Census Bureau collects demographic data is changing!

Assumption 3: Everyone uses public water

What about private wells?

In 2024, the US EPA attempted to predict the probability that residents within a census block were using water from a public utility or private well.

Assumption 3: Everyone uses public water

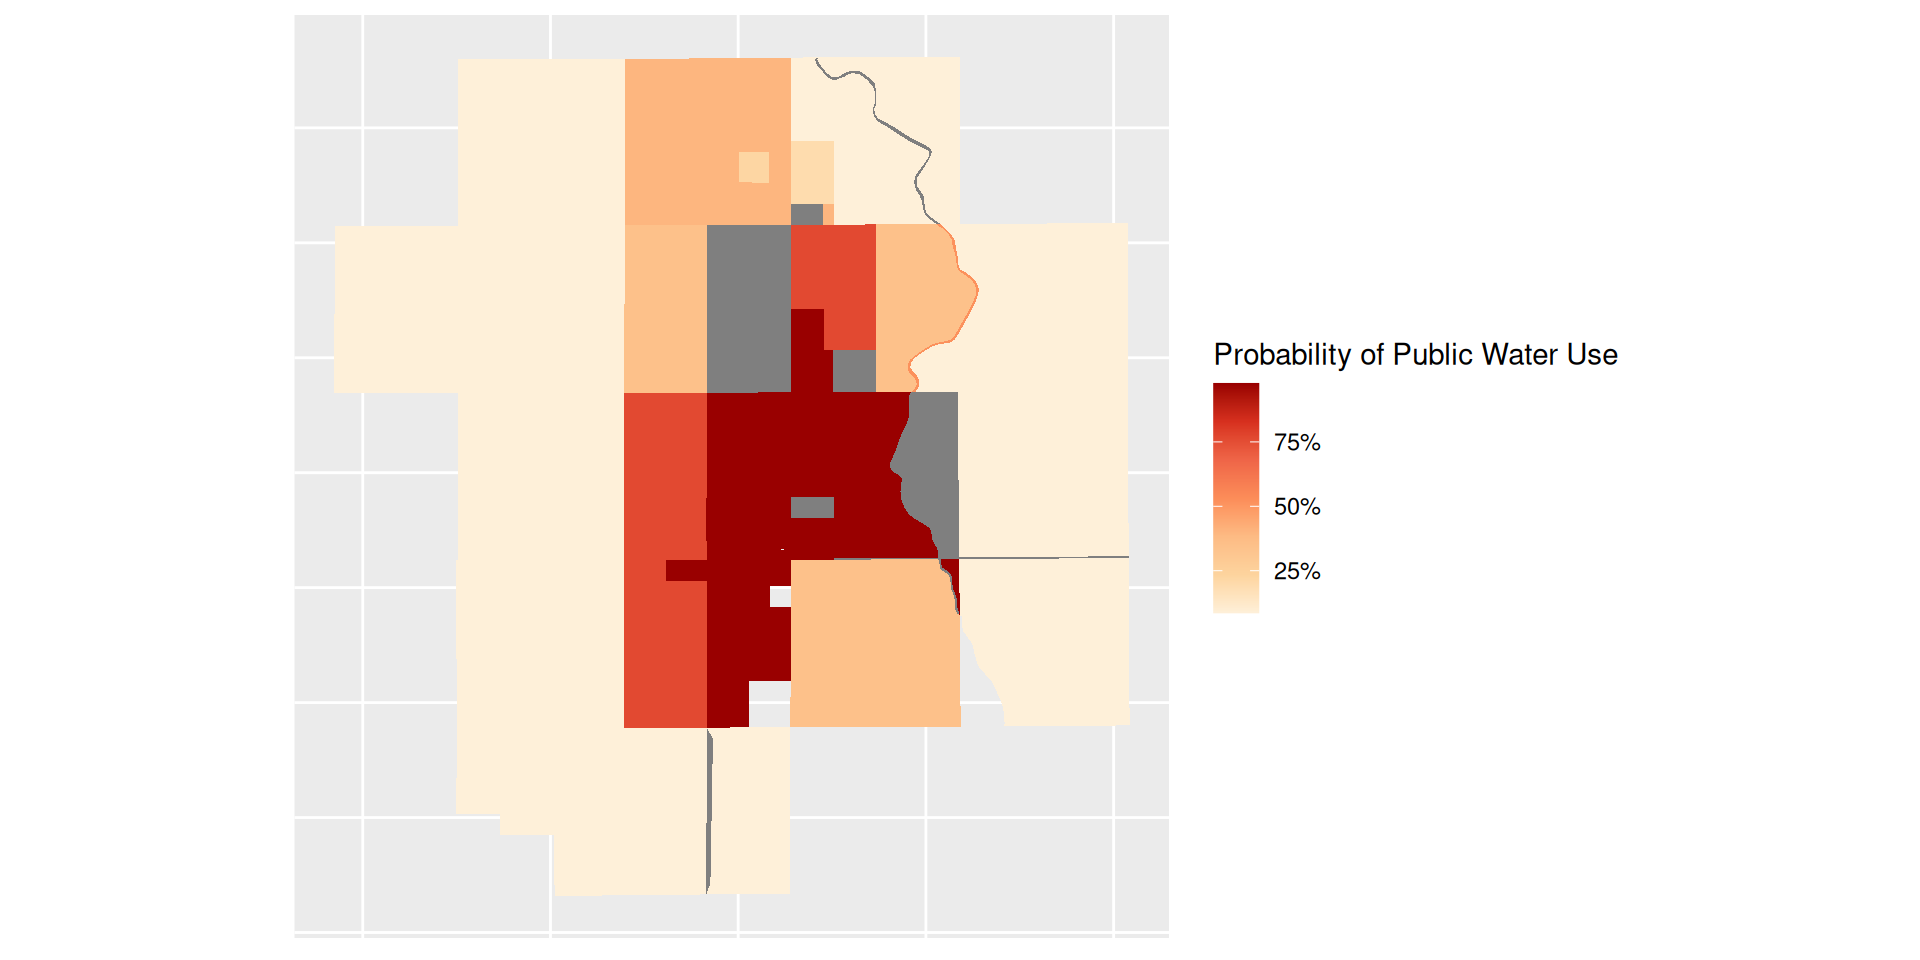
Let’s use EPA’s estimates of probability of public water use to see where Lamont residents are most likely to use public water.

1well_data_file <- paste(here(), "data/raw/well_blocks.csv", sep="/")
  
if (!file.exists(well_data_file)) {
  res <- download.file("https://media.githubusercontent.com/media/USEPA/ORD_Water_Source_2020/5e717b36419251bec97d8795a2e08308f9a7faef/outputs/Well_Estimates_2020_Blks.csv?download=true",
                       destfile=well_data_file)
}

2water_sources <- read_tsv(well_data_file)

3city_blocks_with_water_sources <- merge(city_blocks,
                                        water_sources,
                                        by.x = "GEOID",
                                        by.y = "GEOID_Blk",
                                        all.x = TRUE)
1
Conditionally download EPA data. (Use the here package to form filepaths from a stable root!)
2
Load EPA data into R with the read_tsv() method from the readr package.
3
Join Census and EPA data.

Assumption 3: Everyone uses public water

Probability Household Uses Public Water Utility
NAME Prob_Pub
Block 1000, Block Group 1, Census Tract 64.03, Kern County, California 0.98
Block 1001, Block Group 1, Census Tract 64.03, Kern County, California 0.98
Block 1002, Block Group 1, Census Tract 64.03, Kern County, California 0.98
NAME Prob_Pub
Block 1011, Block Group 1, Census Tract 62.01, Kern County, California 0.09
Block 1013, Block Group 1, Census Tract 62.01, Kern County, California 0.09
Block 1014, Block Group 1, Census Tract 62.01, Kern County, California 0.09

Assumption 3: Everyone uses public water

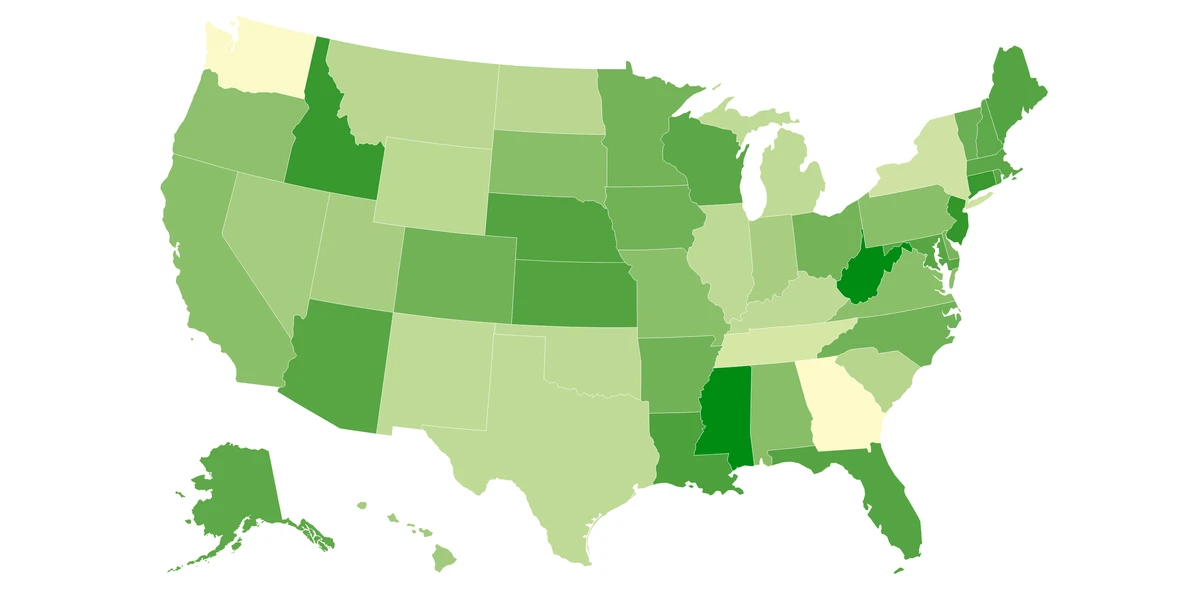
Now, let’s make a choropleth map of likelihood of public water use. Choropleth maps shade geographies by a particular value, making it easy to see how that value varies across space.

Example of a choropleth map

Assumption 3: Everyone uses public water

ggplot() +
1  geom_sf(city_blocks_with_water_sources,
2          mapping = aes(geometry = geometry,
                        fill = Prob_Pub),
                        color = NA) +
3  scale_fill_distiller(palette = "OrRd", direction = 1, labels = scales::percent) +
4  labs(fill = "Probability of Public Water Use") +
  theme(axis.ticks = element_blank(),
        axis.text.x = element_blank(),
        axis.text.y = element_blank())
1
Add geographic layer (map).
2
Define an aesthetic, or how fill (or other map attributes) should vary based on a particular value.
3
Generate a color scheme optimized for mapping.
4
Add a legend title.

Assumption 3: Everyone uses public water

Assumption 4: The population of Lamont is evenly distributed

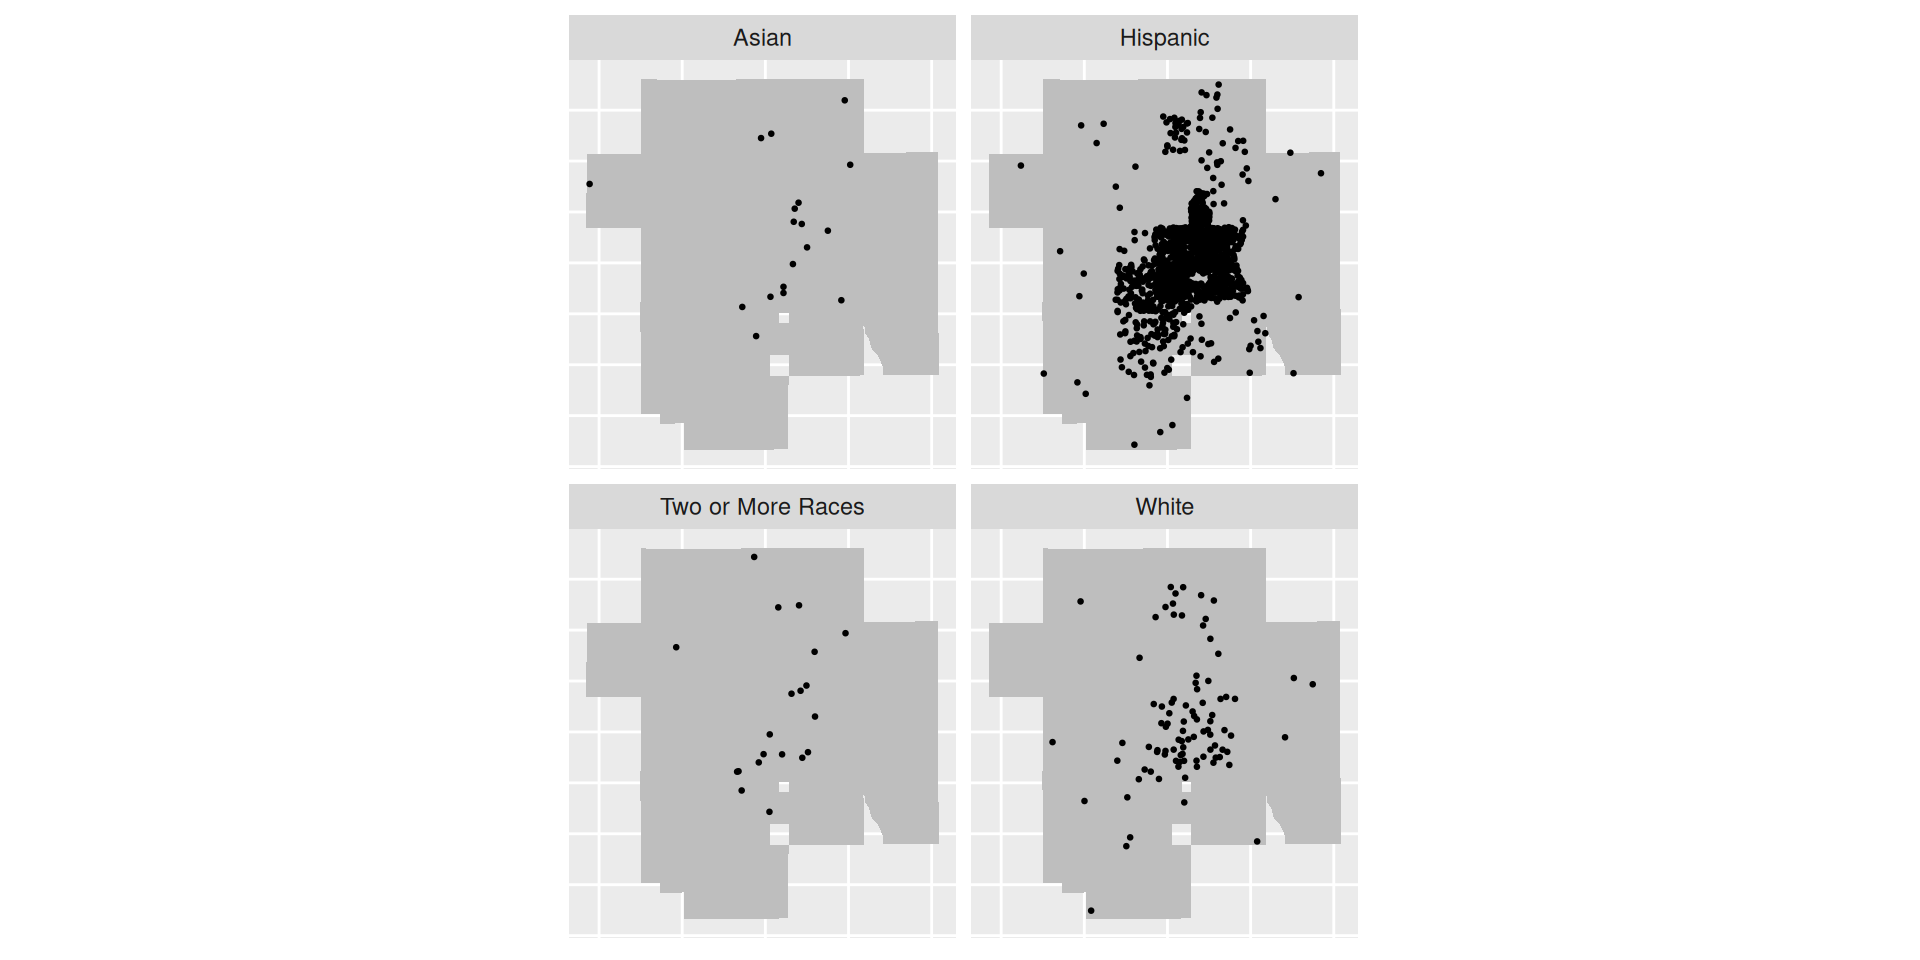
We know that the probability of public water use, i.e., exposure to contaminants, varies by where someone lives. What are the population dynamics in Lamont? Are residents of all races & ethnicities evenly distributed?

Let’s make some dot density maps to find out!

Assumption 4: The population of Lamont is evenly distributed

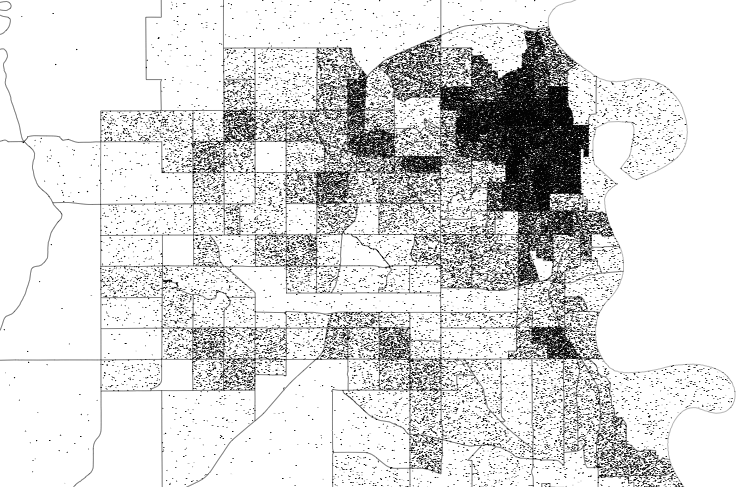
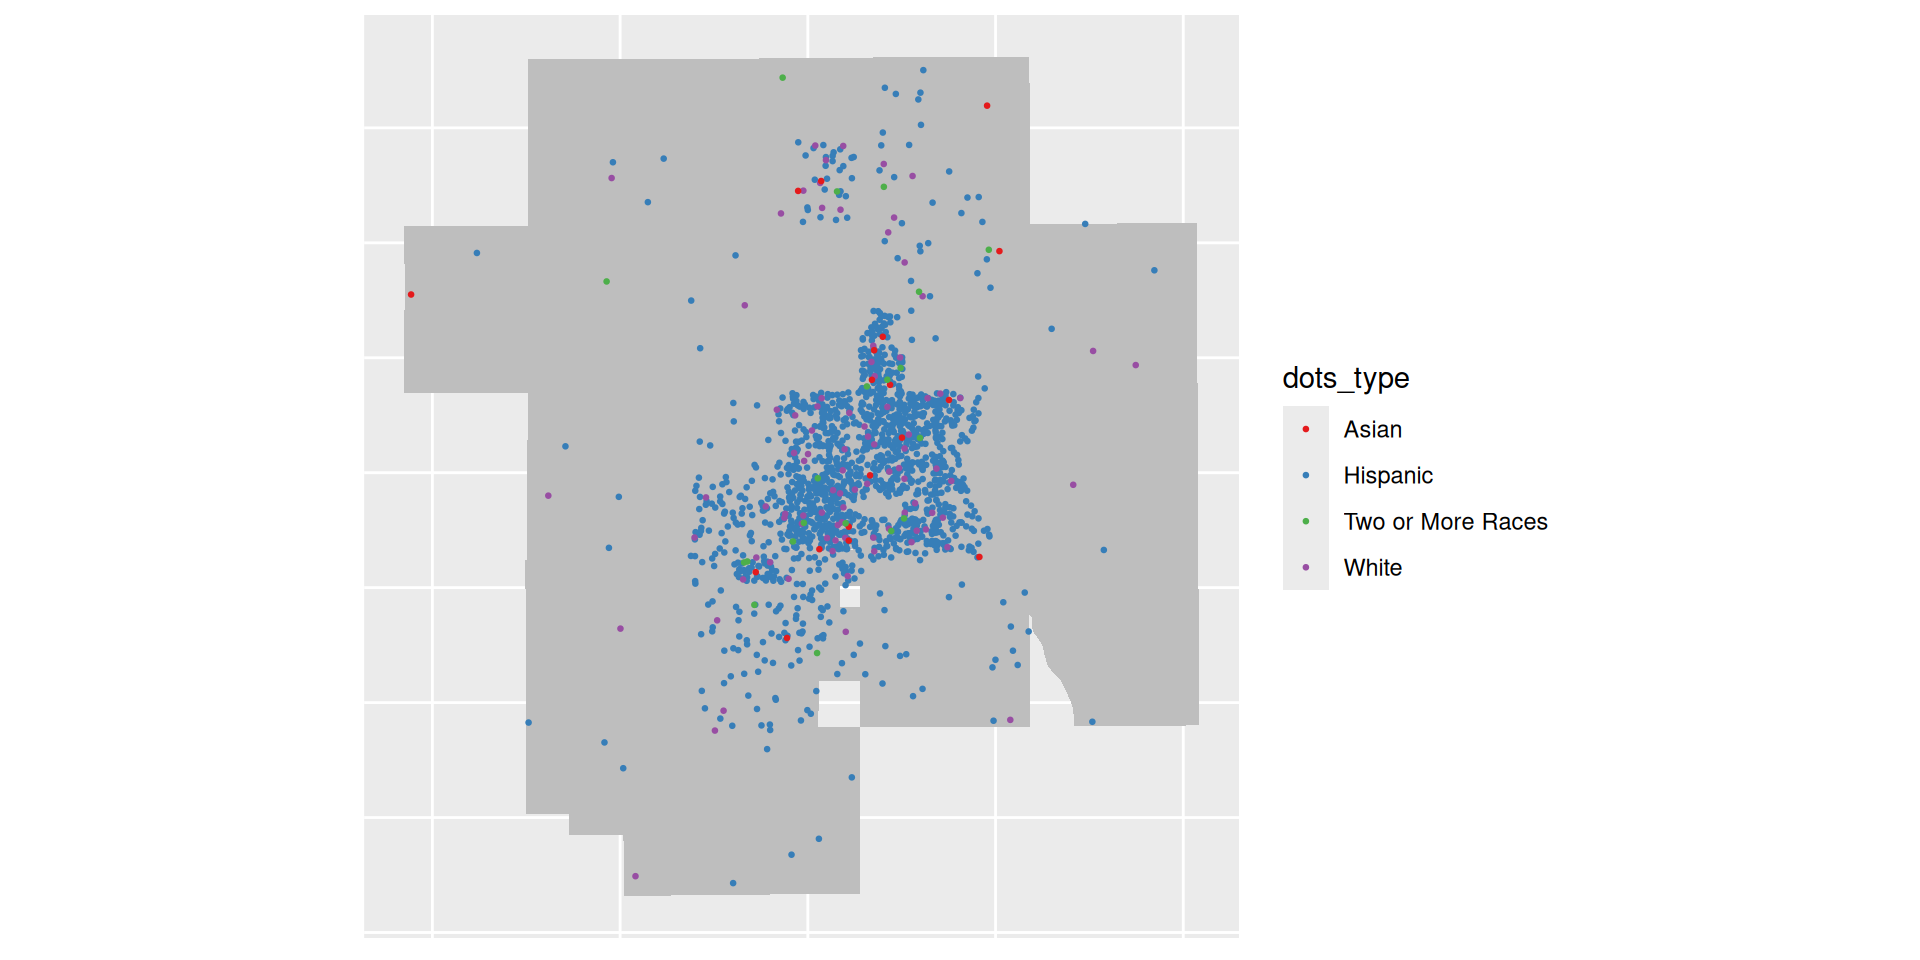
A dot density map places dots representing one (or more) people or instances of a phenomenon randomly within the geography where they live or occur. It approximately illustrates the distribution of people or events in space.

Example of dot density map

N.b., Dots are randomly placed, i.e., the location of a dot does not indicate the location of a person or event.

Assumption 4: The population of Lamont is evenly distributed

Let’s use the dots R package to generate random dot data for our maps.

race_dots <- dots::dots_points(shp = city_blocks,
                               cols = c(value_Hispanic,
                                        value_White,
                                        value_Asian,
                                        value_TwoOrMoreRaces),
1                               divisor = 10)  %>%
  mutate(dots_type = case_when(dots_type == "value_Hispanic" ~ "Hispanic",
                               dots_type == "value_White" ~ "White",
                               dots_type == "value_Asian" ~ "Asian",
2                               dots_type == "value_TwoOrMoreRaces" ~ "Two or More Races"))
1
Create dot layer, where divisor defines how many people one dot represents.
2
Add a new column that creates a friendly label for each group.

Assumption 4: The population of Lamont is evenly distributed

Next, let’s make our map.

ggplot() +
    geom_sf(data = city_blocks,
1          fill = "grey", color = NA) +
2  geom_sf(data = race_dots, size = 0.5, mapping = aes(color = dots_type)) +
3  scale_color_brewer(type = "qual", palette = 6) +
  theme(axis.ticks = element_blank(),
        axis.text.x = element_blank(),
        axis.text.y = element_blank())
1
Use the Census blocks as a neutral base layer.
2
Add dots, colored by the group they represent.
3
Generate another color palette optimized for mapping.

Assumption 4: The population of Lamont is evenly distributed

Assumption 4: The population of Lamont is evenly distributed

Let’s use small multiples to make our map more legible.

ggplot() +
    geom_sf(data = city_blocks,
          fill = "grey", color = NA) +
1  geom_sf(data = race_dots, size = 0.5) +
2  facet_wrap(~ dots_type) +
  theme(legend.position = "none",
        axis.ticks = element_blank(),
        axis.text.x = element_blank(),
        axis.text.y = element_blank())
1
Remove the aesthetic we used to color our dots.
2
Use facet_wrap() to tell ggplot2 to make a new plot for each group.

Assumption 4: The population of Lamont is evenly distributed

Putting it all together

Putting it all together

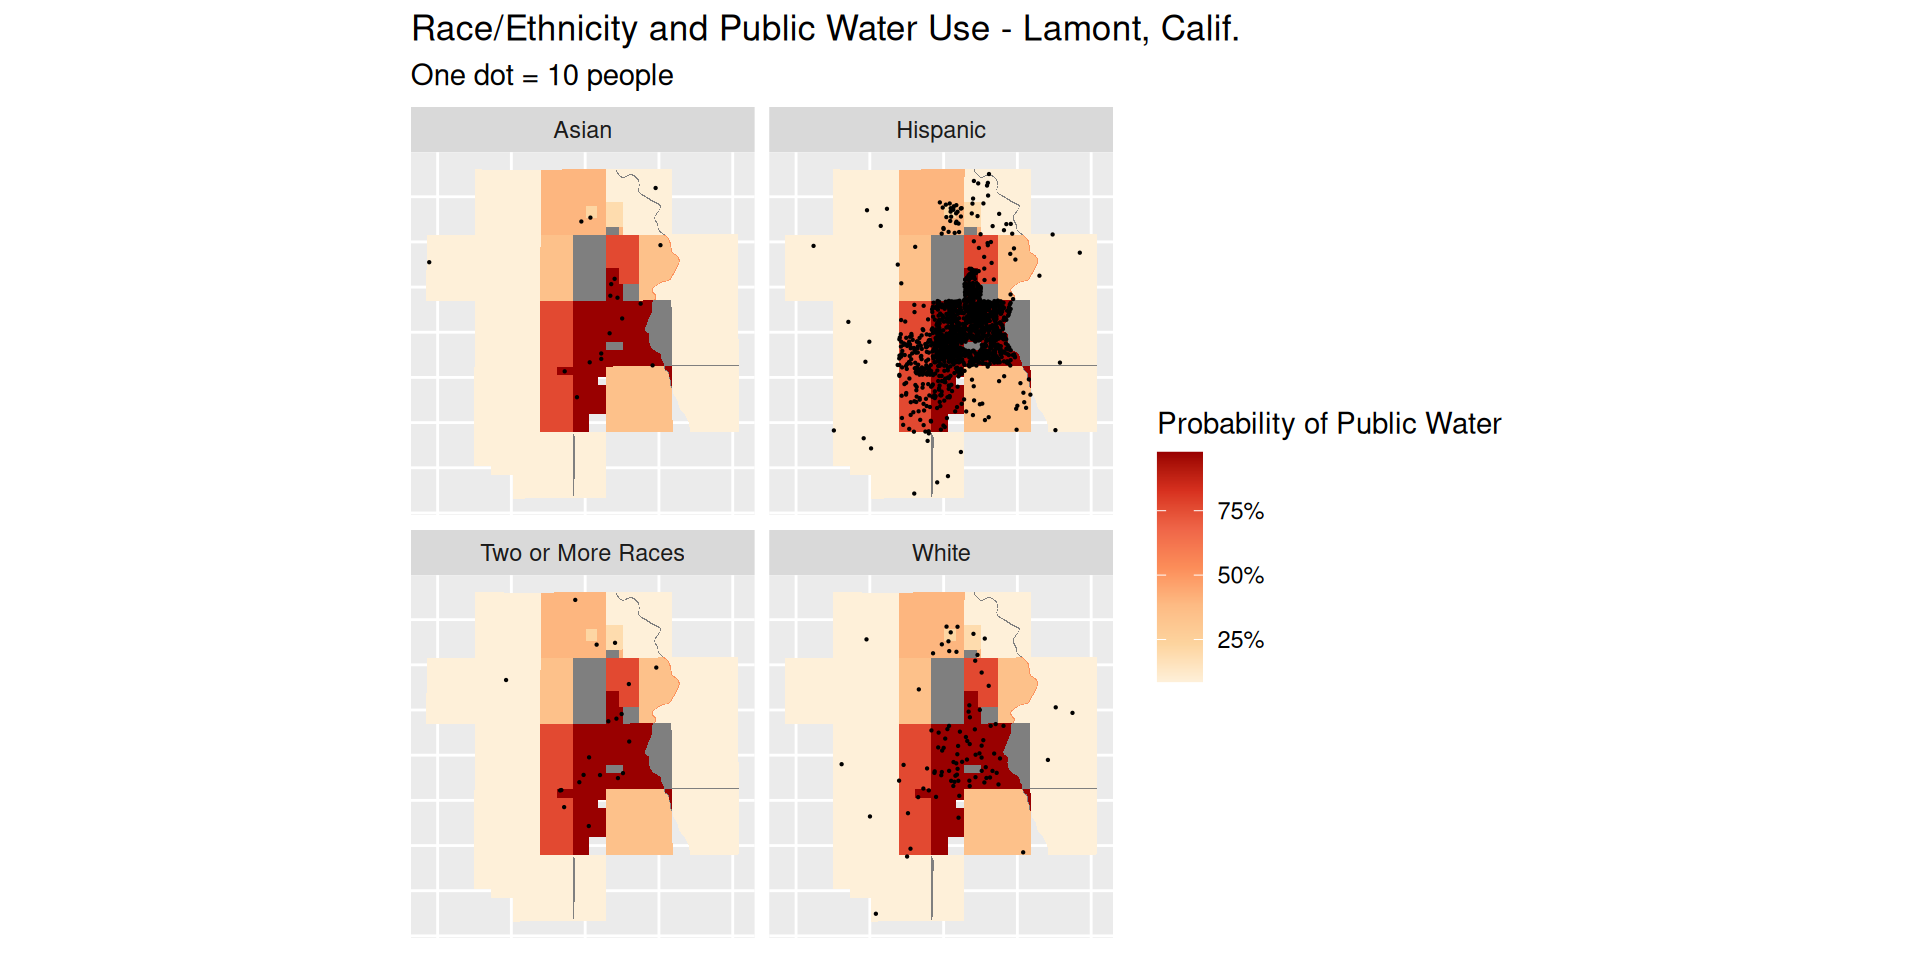
We know that both the probability of public water use and the race/ethnicity of residents varies by Census block. We can overlay our water use map with our dot density maps to illustrate that point.

ggplot() + geom_sf(city_blocks_with_water_sources, mapping = aes(geometry = geometry,
    fill = Prob_Pub), color = NA) + scale_fill_distiller(palette = "OrRd",
    direction = 1, labels = scales::percent) + labs(title = "Race/Ethnicity and Public Water Use - Lamont, Calif.",
    subtitle = "One dot = 10 people", fill = "Probability of Public Water") +
    theme(axis.ticks = element_blank(), axis.text.x = element_blank(),
        axis.text.y = element_blank()) + geom_sf(race_dots, size = 0.1,
    mapping = aes(geometry = geometry)) + facet_wrap(~dots_type)

Putting it all together

Putting it all together

To put a finer point on it, we can estimate the proportion of each group likely using public water by calculating average probability of public water use weighted by the size of each group.

demo_summary <- city_blocks_with_water_sources %>%
  summarize(
1    prop_white = weighted.mean(Prob_Pub, w = value_White, na.rm = TRUE),
    prop_asian = weighted.mean(Prob_Pub, w = value_Asian, na.rm = TRUE),
    prop_hispanic = weighted.mean(Prob_Pub, w = value_Hispanic, na.rm = TRUE),
    prop_tom = weighted.mean(Prob_Pub, w = value_TwoOrMoreRaces, na.rm = TRUE),
    pp_white = sum(Prob_Pub * value_White, na.rm = TRUE),
    pp_asian = sum(Prob_Pub * value_Asian, na.rm = TRUE),
    pp_hispanic = sum(Prob_Pub * value_Hispanic, na.rm = TRUE),
    pp_tom = sum(Prob_Pub * value_TwoOrMoreRaces, na.rm = TRUE),
    white = sum(value_White, na.rm = TRUE),
    asian = sum(value_Asian, na.rm = TRUE),
    hispanic = sum(value_Hispanic, na.rm = TRUE),
    tom = sum(value_TwoOrMoreRaces, na.rm = TRUE)
  )
1
Use the weighted.mean() method from the stats package to calculate weighted average.

Putting it all together

Race / Ethnicity Total Using Public Water Percentage
Hispanic 14,650 13,420 92%
White 514 398 77%
Asian 57 41 71%
Two or More Races 76 59 78%

What’s next?

Take 10 minutes to discuss next steps you might take, given our findings. Some examples include:

  • Talking to people in Lamont
  • Identifying and answering additional questions
  • Researching existing programs and resources

Use this planning guidance from the handbook for extra context, if needed.

One person from each group will share a summary of their group’s discussion when we reconvene.

Resources shared during the training